Visuals

Bubble Chart

Also called: Bubble graph, Bubble plot

A bubble chart is a scatter plot where each dot's size shows a third measure. It compares items on three numbers at once, such as growth, margin and revenue by region.
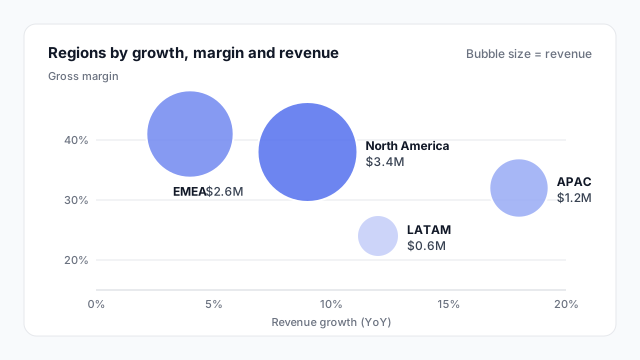
Bubble chart of four regions by revenue growth and gross margin, with bubble area showing revenue: North America 9% growth, 38% margin, $3.4M; EMEA 4%, 41%, $2.6M; APAC 18%, 32%, $1.2M; LATAM 12%, 24%, $0.6M.

How to read a bubble chart

A bubble chart encodes three measures for each item:

  1. Horizontal position (x). Here, revenue growth year over year.
  2. Vertical position (y). Here, gross margin.
  3. Bubble size. Here, revenue.

So in the chart above you can read that North America is the biggest region ($3.4M) with solid margin, while APAC is small ($1.2M) but growing fastest at 18%. LATAM is small, growing and low-margin, which is a different conversation.

A fourth measure is sometimes added as colour, but every extra encoding makes the chart slower to read. Three is usually the limit.

Bubble chart vs. packed bubbles

The name “bubble chart” covers two quite different visuals:
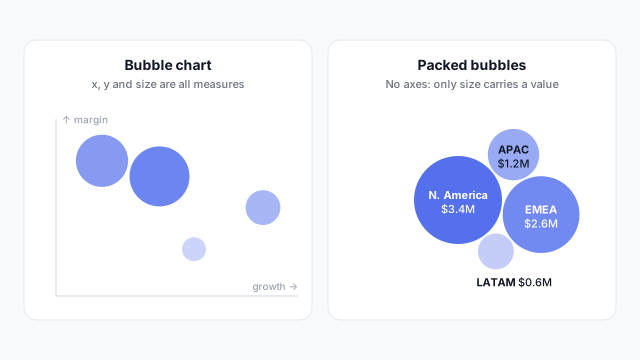
Left: a bubble chart with bubbles placed by growth and margin and sized by revenue. Right: packed bubbles for the same regions with no axes

  • Bubble chart (on axes): position and size are all measures. Good for portfolio views, like regions or products by growth, margin and size.
  • Packed bubbles: circles clustered with no axes. It only shows size, so a bar chart usually does the same job more precisely. Use it when the look matters more than precision, such as a landing-page summary.

Common uses

Ordered from most to least common.

  1. Portfolio views. Regions, products or clients by growth, profitability and size. The classic use.
  2. Market maps. Competitors by price and quality, sized by market share.
  3. Risk maps. Projects or risks by likelihood and impact, sized by cost.

Size bubbles by area

The most common bubble-chart mistake is scaling the radius to the value. A bubble with four times the value then gets sixteen times the area, and looks far bigger than it should.
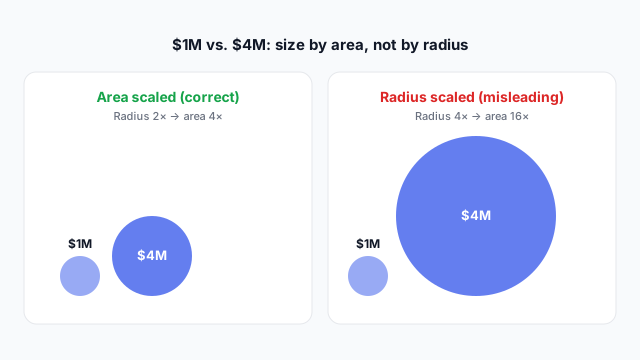
Two pairs of $1M and $4M bubbles: area scaled, where the $4M bubble has twice the radius, and radius scaled, where it has four times the radius and looks sixteen times bigger

Power BI and Tableau both size by area for you. Check custom visuals and hand-built charts.

In Power BI vs. Tableau

Power BITableau
Bubble chart on axesScatter chart with a measure in SizeScatter plot with a measure on Size in the Marks card
Packed bubblesNot built in; available as custom visualsPacked bubbles in Show Me

Best practices

  • Keep it to about 15 bubbles. Past that they overlap and the small ones disappear.
  • Label bubbles directly with the item name and size value.
  • Add a size note such as “Bubble size = revenue”. Readers can’t guess the third measure.
  • Use some transparency or a white outline so overlapping bubbles stay visible.

Mocking up a bubble chart

Bubble charts take more space than people expect, and a big bubble near the edge gets clipped. Place it on a mockup first to check the size it needs and agree which three measures it shows.

Related terms

Common questions

What's the difference between a bubble chart and a scatter plot?
A scatter plot uses two measures: one for each axis. A bubble chart adds a third measure as the size of each dot. Use a scatter plot when size wouldn't add anything, because equal dots are easier to read.
How do I make a bubble chart in Power BI?
Use the built-in Scatter chart and drag a measure into the Size field. Each dot becomes a bubble sized by that measure. There's no separate bubble chart visual.
Is a packed bubble chart the same as a bubble chart?
No. Packed bubbles cluster circles together with no axes, so only size carries a value. A bubble chart places each bubble on x and y axes as well, so it shows three measures instead of one.

Mock it up before you build it

Lay out your Power BI or Tableau dashboard in Mockko, get sign-off, then build. Free to start.

Try Mockko free