What it looks like
A DAX formula starts with a name, then an equals sign, then an expression. Most report logic lives in measures: formulas that are calculated when a visual needs them.
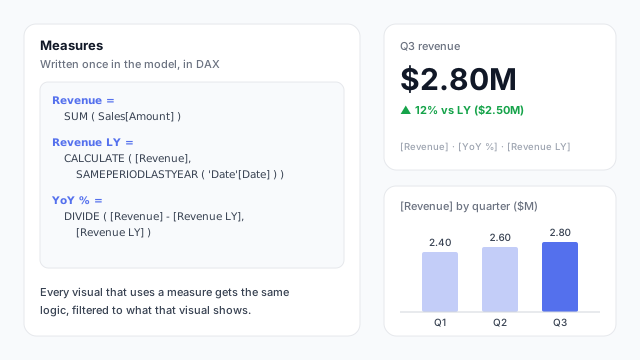
Revenue = SUM ( Sales[Amount] )

Revenue LY =
    CALCULATE ( [Revenue], SAMEPERIODLASTYEAR ( 'Date'[Date] ) )

YoY % =
    DIVIDE ( [Revenue] - [Revenue LY], [Revenue LY] )
Measures build on each other. Revenue LY reuses Revenue with the dates moved back a year, and YoY % reuses both. In the example, the KPI card shows Revenue of $2.80M and Revenue LY of $2.50M, so YoY % is ($2.80M − $2.50M) ÷ $2.50M = 12%. The column chart reuses the same Revenue measure by quarter: $2.40M, $2.60M and $2.80M.
SAMEPERIODLASTYEAR is a time intelligence function and needs a proper date table: one row per day, with no gaps, related to the fact table.
Filter context: why one measure gives many answers
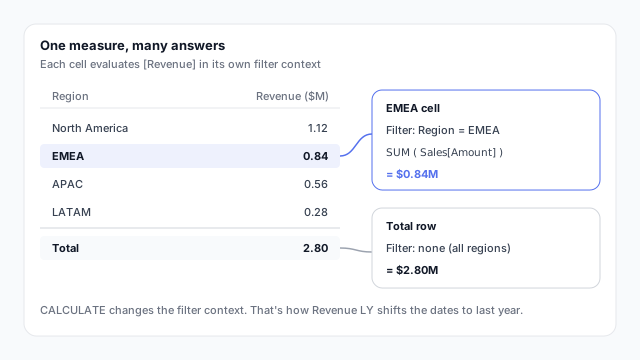
A measure has no single value. Each cell of a visual evaluates it with that cell’s filters applied, which DAX calls the filter context. In the matrix, the EMEA row runs SUM ( Sales[Amount] ) over EMEA rows only and gets $0.84M. The total row has no region filter and gets $2.80M, the sum of the four regions. Slicers, page filters and drillthrough filters all add to the filter context too.
CALCULATE is the function that changes filter context, which is why it appears in almost every non-trivial measure. Revenue LY is Revenue with the date filter swapped for the same period last year.
Where DAX is used
- Measures: totals, ratios, comparisons and time intelligence for visuals. This is most DAX.
- Calculated columns: a value per row, worked out at refresh. See measure vs. calculated column.
- Calculated tables: whole tables built from a formula, such as a date table.
- Row-level security: role filters such as
[Region] = "EMEA".
Best practices
- Prefer measures to calculated columns for anything that’s aggregated or depends on filters.
- Use DIVIDE, not ”/”. It returns blank instead of an error when the denominator is zero.
- Use variables (
VAR … RETURN) to name intermediate steps. Formulas get easier to read and often faster.
- Format and comment measures. Line breaks and a short
// comment save the next person an hour.
- Keep a measures table. Grouping measures in one place makes them easy to find in the field list.
Mocking up before writing DAX
Every number on a mockup becomes a measure, so a signed-off mockup is also a list of the DAX you need to write and the comparisons (vs. last year, vs. target) each one needs. See why to mock up Power BI reports before you build.