SaaS Metrics Dashboard Mockup Template
The SaaS Metrics dashboard template is a one-page subscription review layout for growth, finance and RevOps teams, built to decide whether recurring revenue is growing, and whether churn or expansion is driving the change. It shows MRR, net revenue retention, logo churn rate, ARPA, MRR movement and churn by plan.
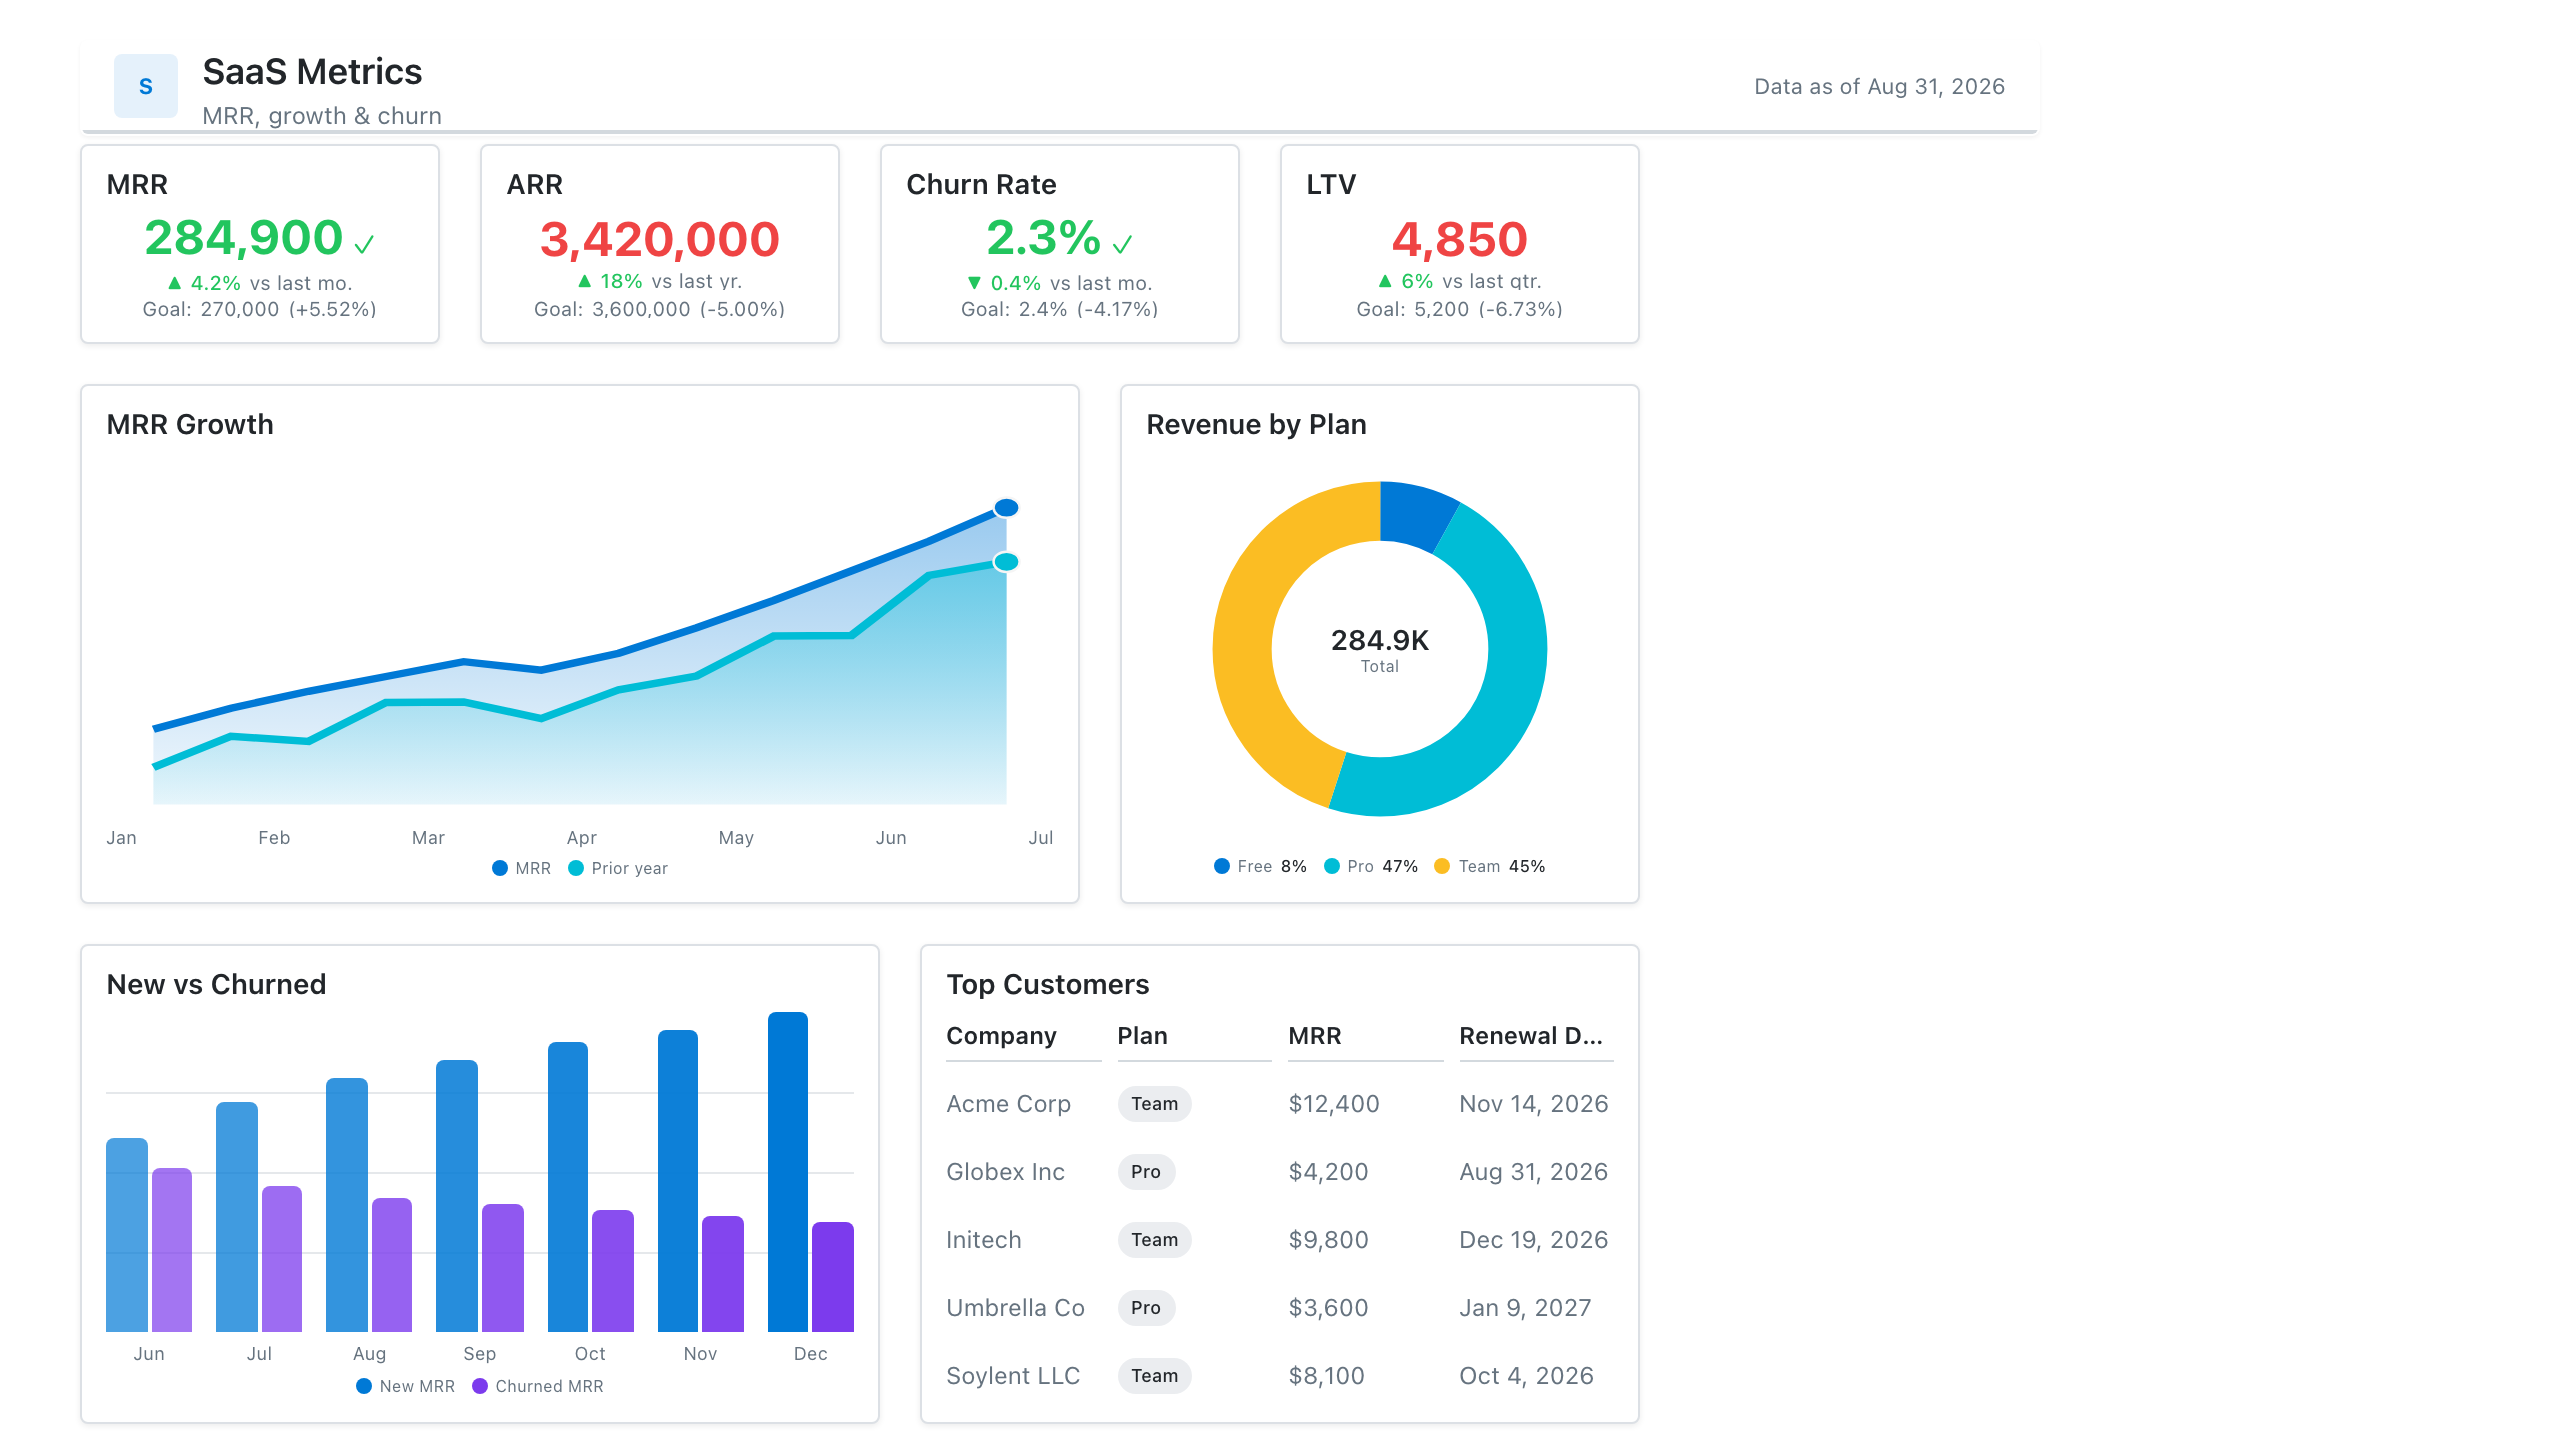
Click the mockup to open it full size
About this template
SaaSThe subscription-business scorecard: MRR and NRR KPIs, a new-vs-expansion-vs-churn MRR bridge, and activation and retention trends. Built for the weekly growth review and the investor update.
Metrics this dashboard tracks
- MRR / ARR
- Net & gross revenue retention
- Logo & revenue churn
- New vs. expansion MRR
- Activation rate
- CAC payback
What's on the SaaS Metrics dashboard?
| Section | What it shows | Why it's here |
|---|---|---|
| Header and filters Title card, date range picker, two dropdown filters | The report title ("SaaS Subscription Metrics & Revenue Retention"), a subtitle, a data last updated timestamp, and filters for reporting period, plan tier and customer segment. | Lets one page serve every plan and segment, so the reader confirms the scope and data freshness before reading any number. |
| KPI row Four KPI cards | Monthly recurring revenue ($1.8M), net revenue retention (108.4%), logo churn rate (2.1%) and average revenue per account ($306), each with the previous quarter value and percentage change. | Gives the four numbers that summarise the health of a subscription business, so the reader knows within seconds whether revenue is growing and whether customers are staying. |
| MRR movement and trend row Stacked column chart, line chart with target line | A stacked column chart of MRR movement by quarter split into new, expansion, contraction and churned MRR (with contraction and churn below the zero line), beside a monthly MRR line from January to December with a dashed annual target line. | The columns explain what changed in MRR and the line shows whether the total is on its way to the annual target, so a drop in growth can be traced to weak new business or rising churn. |
| Plan detail row Table, donut chart | A table of churn and ARPA by plan (Starter, Growth, Professional, Enterprise) with customers, logo churn %, MRR churn % and ARPA, beside a donut chart of MRR mix by plan with the total in the centre. | Shows which plans churn most and which carry the most revenue, so the team can see whether the high-churn plans are small or large in dollar terms. |
What each metric means
Monthly recurring revenue (MRR)
- Definition: The normalised monthly value of all active subscriptions at a point in time. Annual plans are divided by 12. Companies differ on whether to include usage fees, discounts and trials, so state the rule you use.
- Formula:
MRR = sum of monthly subscription value for all active customers - Why it matters: It is the main measure of the size and growth of a subscription business.
- Why a KPI card: A single large figure with a change against the previous quarter gives the headline number at a glance.
MRR trend and target
- Definition: MRR at the end of each month across the reporting period, plotted against an annual target line. ARR is MRR multiplied by 12 and is sometimes shown instead.
- Formula:
ARR = MRR x 12 - Why it matters: It shows whether growth is steady and whether the company is on course to reach its target.
- Why a line chart: A line over months shows direction and pace, and a dashed target line shows the gap to goal.
Net revenue retention (NRR)
- Definition: The share of recurring revenue kept from existing customers over a period, including expansion and after contraction and churn, and excluding new customers. Most teams measure it over twelve months, but quarterly and monthly versions exist, so label the period.
- Formula:
NRR = (starting MRR + expansion MRR - contraction MRR - churned MRR) / starting MRR - Why it matters: A value above 100% means existing customers are growing revenue by themselves, even before any new customer is added.
- Why a KPI card: A single percentage with a change indicator suits a ratio that is read against the 100% line.
Logo churn rate
- Definition: The share of customers (logos) at the start of a period that cancelled during it. It counts accounts and ignores their size.
- Formula:
Logo churn rate = customers lost in the period / customers at the start of the period - Why it matters: It shows how many customers are leaving, whatever they paid, which can reveal problems that revenue figures hide.
- Why a KPI card: A small percentage with a change versus last quarter is enough to see whether churn is improving or worsening.
Average revenue per account (ARPA)
- Definition: Average MRR per active customer account. Some companies call it ARPU when accounts are users, so label which one you mean.
- Formula:
ARPA = MRR / number of active accounts - Why it matters: It shows whether the base is moving towards higher-value plans or price changes are working.
- Why a KPI card: One currency value with a change indicator is read the same way as the other headline numbers in the row.
MRR movement (new, expansion, contraction, churned)
- Definition: The change in MRR in each quarter split into four parts: new MRR from new customers, expansion MRR from upgrades and extra seats, contraction MRR from downgrades, and churned MRR from cancelled customers.
- Formula:
Net new MRR = new + expansion - contraction - churned - Why it matters: It explains why MRR changed, which a single total cannot.
- Why a stacked column chart: Stacking the components in one column per quarter shows size and mix together, and placing losses below the zero line separates them from growth.
MRR churn rate by plan
- Definition: The share of starting MRR lost to cancellations in a period, shown here for each plan beside logo churn. Some teams include contraction in this figure and some do not, so state the rule.
- Formula:
MRR churn rate = churned MRR / starting MRR - Why it matters: It weights churn by revenue, so a plan that loses few but large customers is not hidden by a low logo churn.
- Why a table: Four plans with several measures each are compared by exact value, which a table does with columns for customers, churn and ARPA.
MRR mix by plan
- Definition: The share of total MRR that comes from each plan tier.
- Formula:
Plan share = MRR from the plan / total MRR - Why it matters: It shows how dependent revenue is on one tier and puts the churn rates in context.
- Why a donut chart: With four plans, slices show each share of the whole, and the total MRR fits in the centre.
Data you need to build this
- Billing system (Stripe, Chargebee, Recurly or similar) Customer ID, Subscription ID, Plan, Billing interval, Price or amount, Currency, Start date, Cancel date, Status, Discount
- Subscription change history Subscription ID, Change date, Previous MRR, New MRR, Change type (new, upgrade, downgrade, cancel)
- CRM or customer table Customer ID, Segment, Region, Signup date
- Planning sheet Period, MRR or ARR target
Why it's laid out this way
- The four KPI cards sit directly under the filters and use the same layout, so the reader sees revenue size, retention, churn and account value before any chart. Each carries the previous quarter value, so direction is visible straight away.
- The middle row explains the headline. The stacked columns show what moved MRR each quarter and the line shows the running total against the annual target, and the two share a row so a flat line can be matched to a quarter with high churned MRR.
- Plan detail sits at the bottom. The table gives exact churn and ARPA per plan and the donut of MRR mix shows how much revenue each plan carries, so a high churn rate can be judged against the revenue at stake.
Last updated:
More like this
Sales Performance
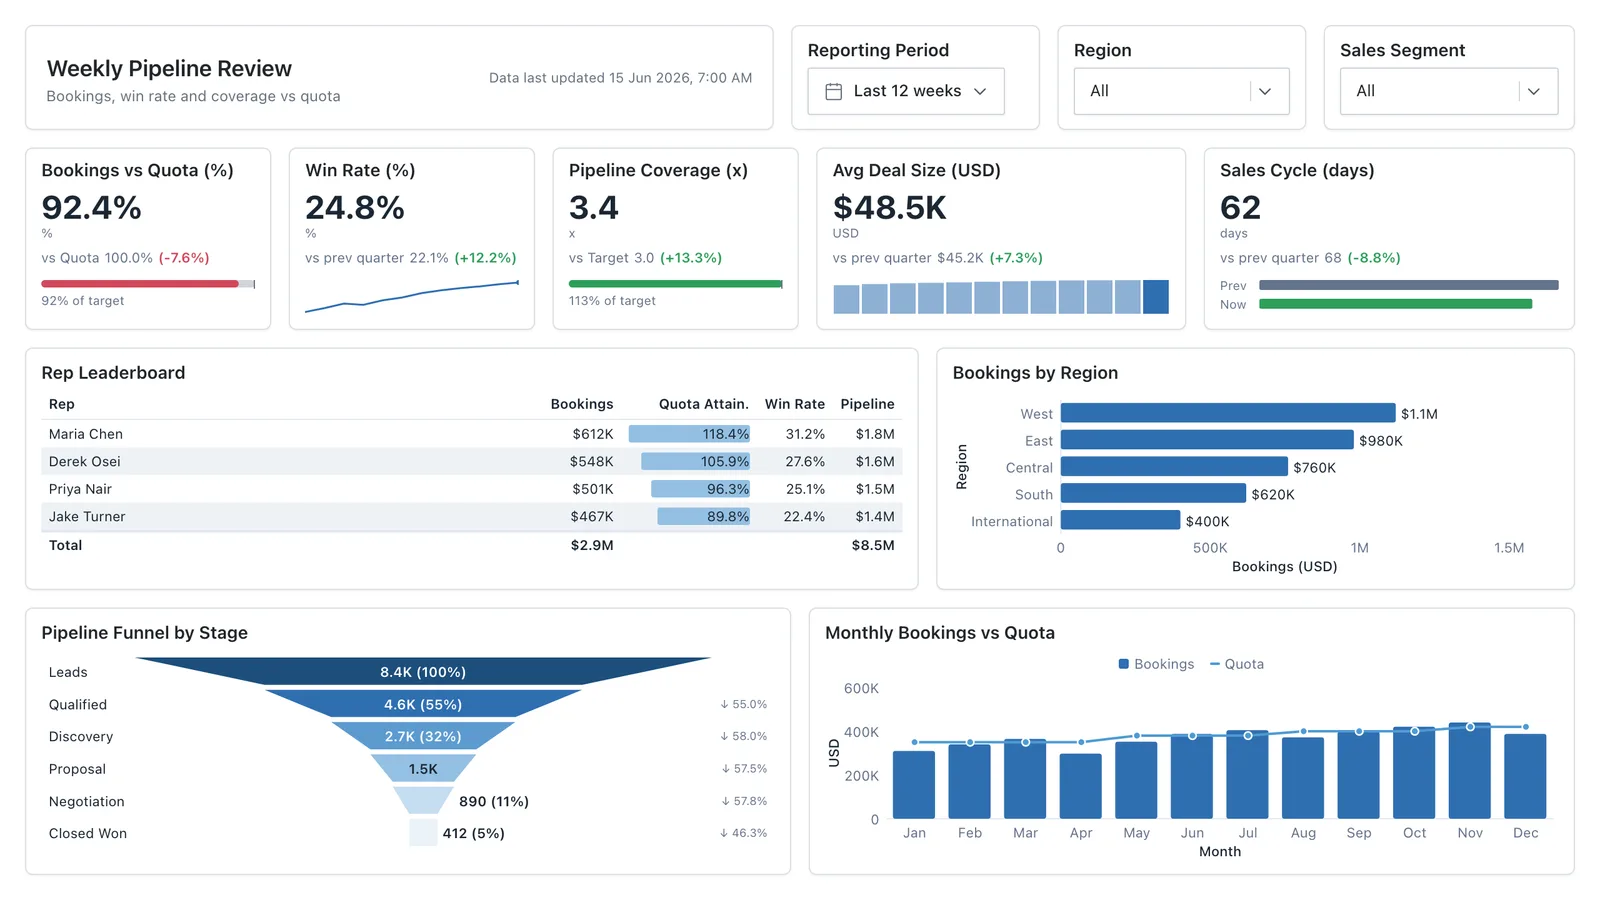
Revenue, win rate, pipeline value, and rep performance across regions — the layout most sales teams build first.
Sales Pipeline
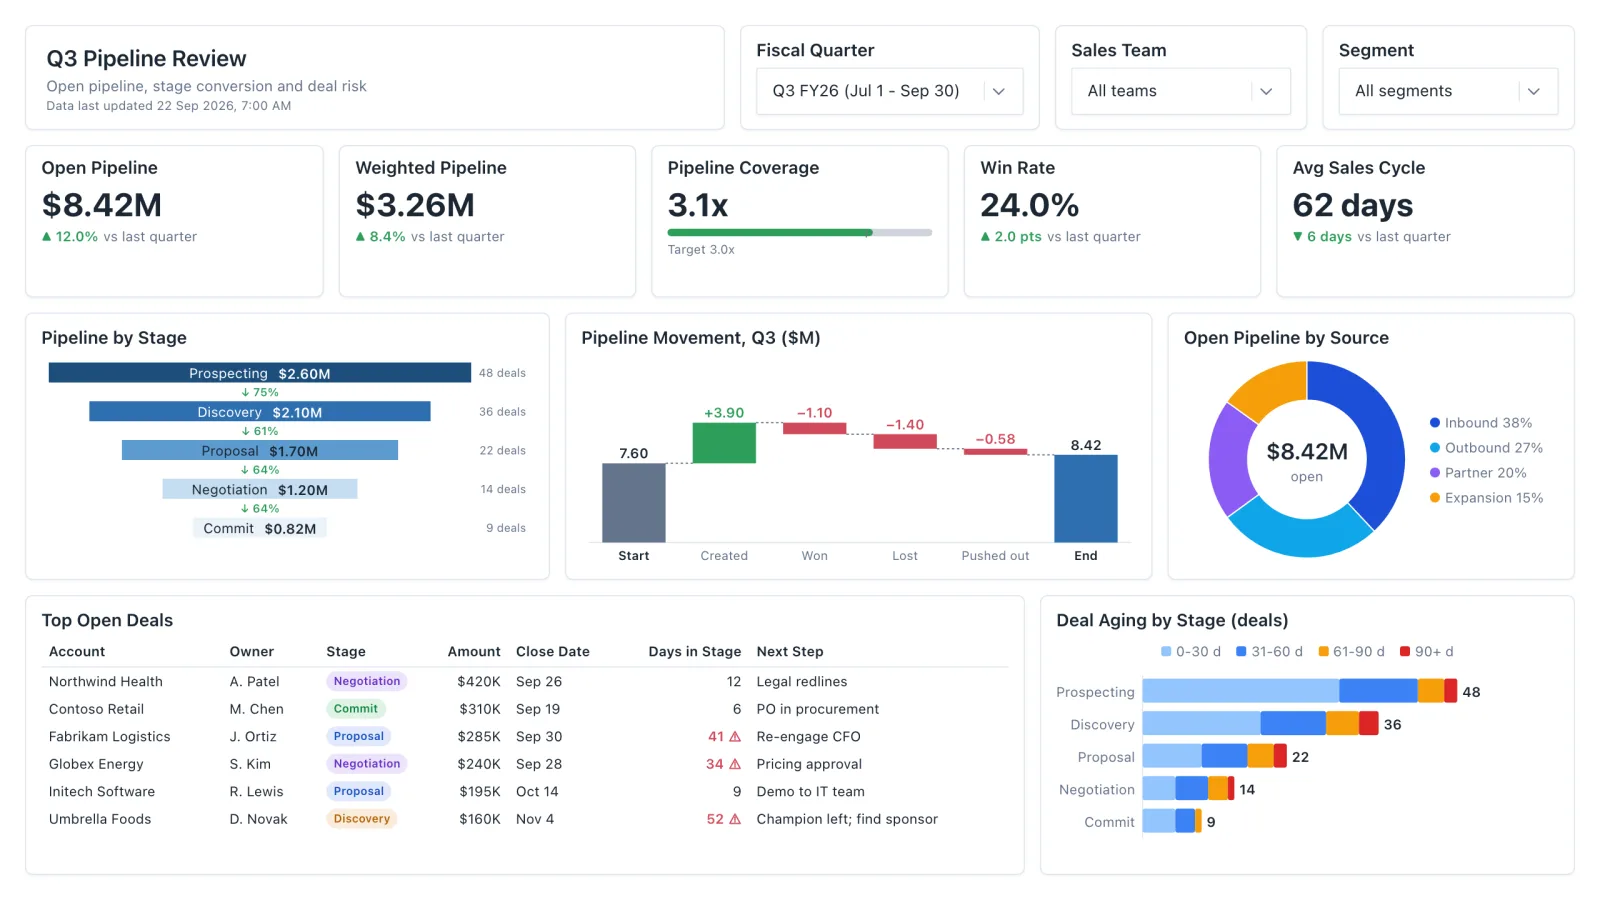
Sales pipeline dashboard with open and weighted pipeline, coverage vs target, a stage funnel and stale-deal flags.
Sales Rep Leaderboard
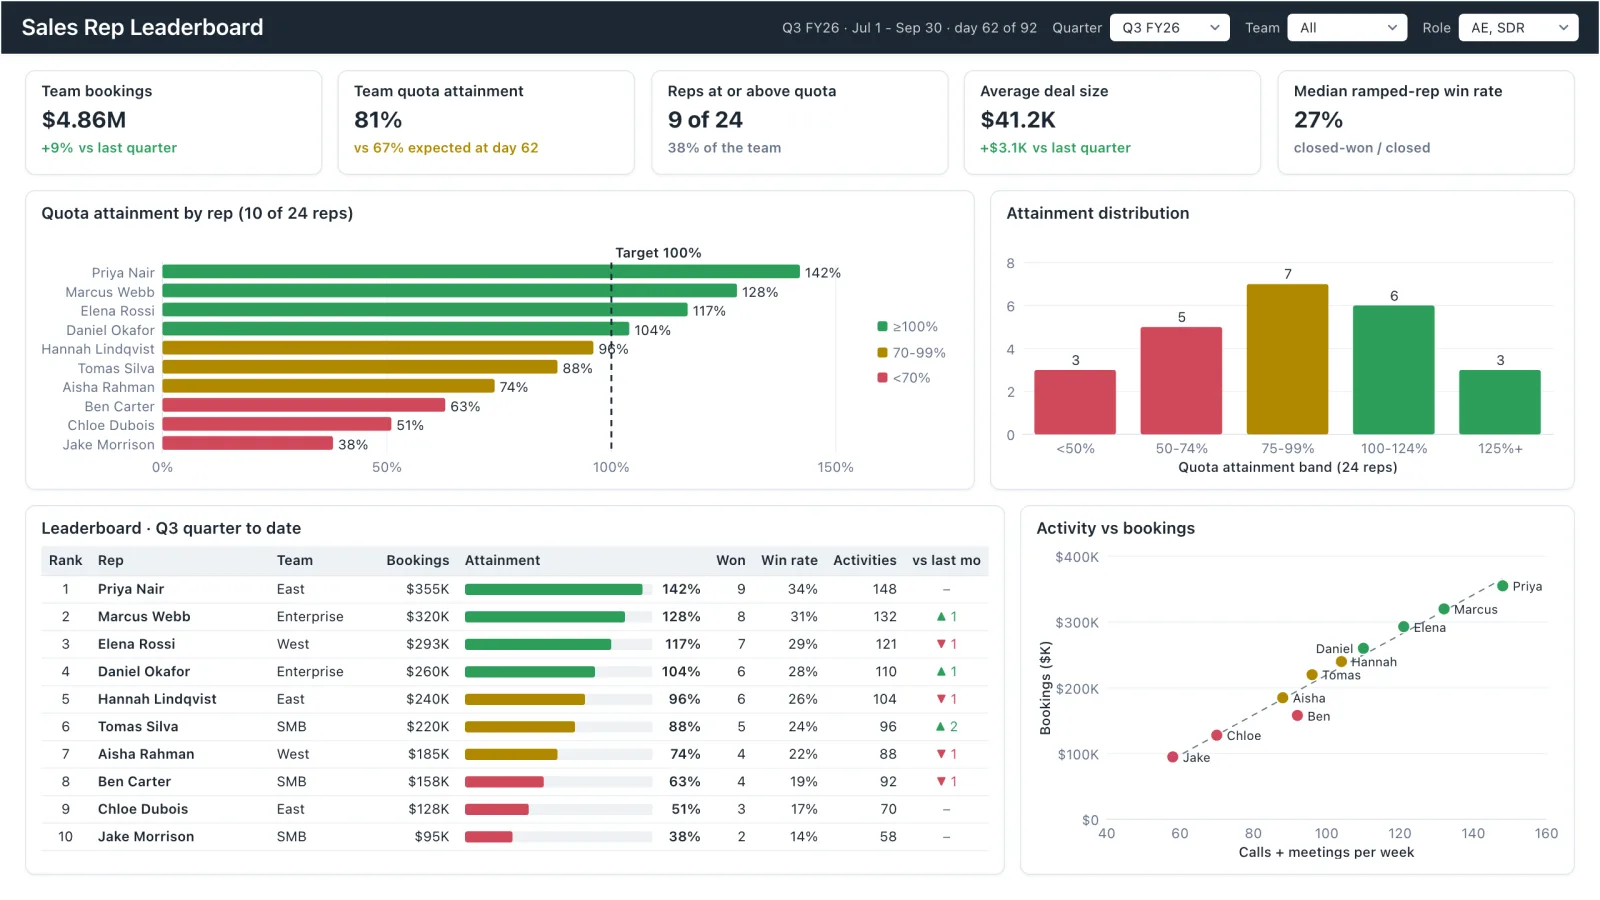
Sales rep dashboard example with quota attainment by rep, a ranked leaderboard table and activity vs bookings.
Marketing Analytics
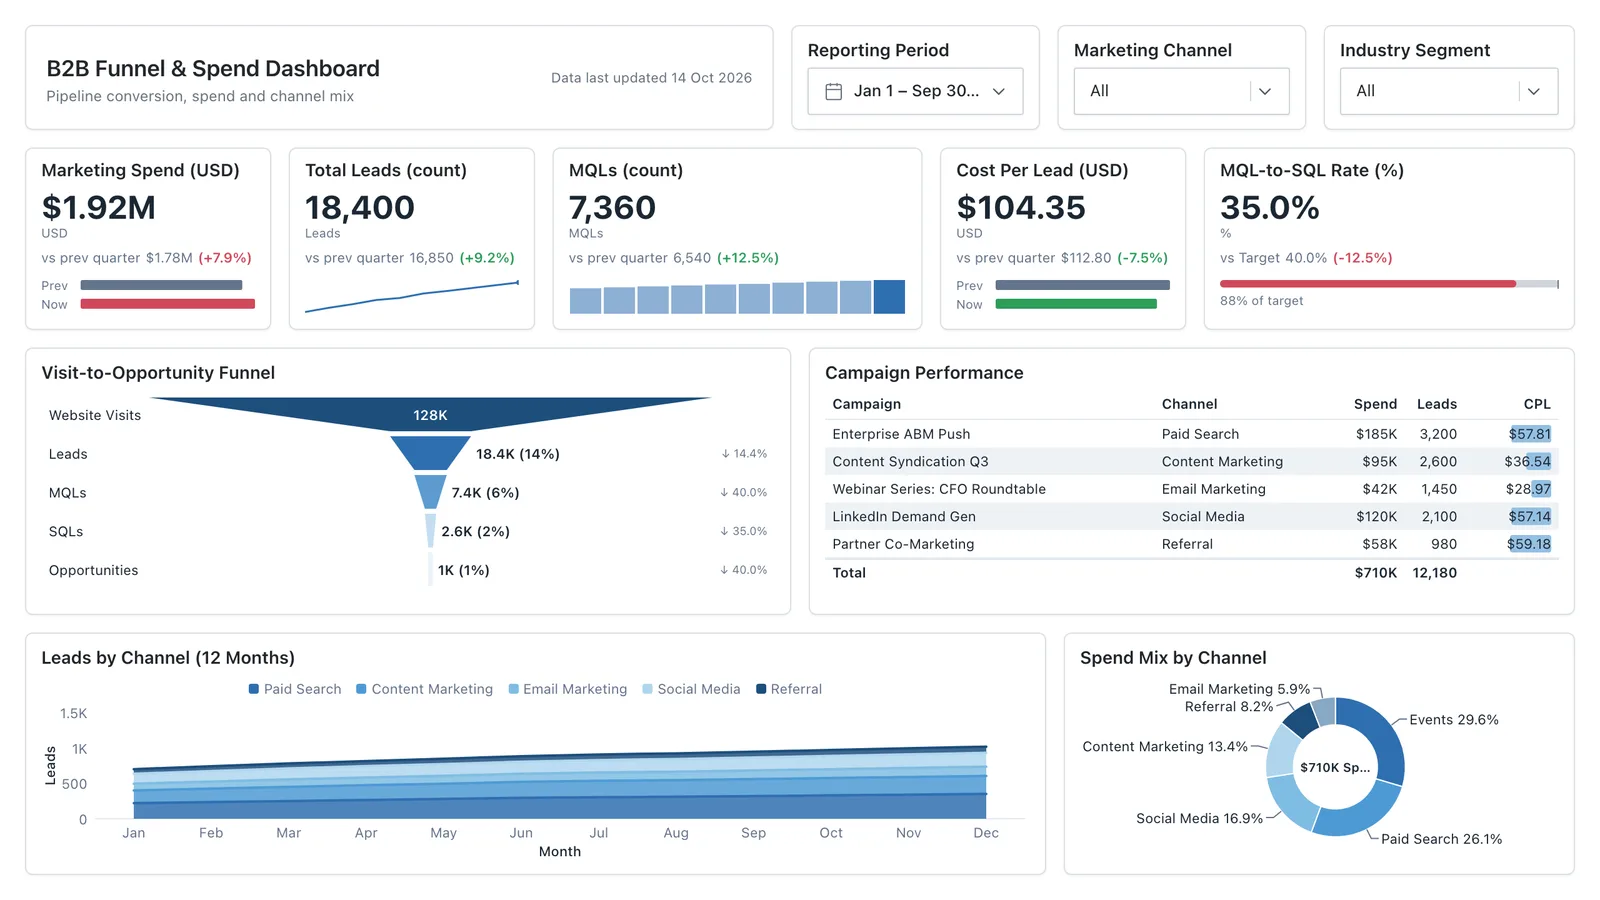
Campaign spend, traffic sources, conversion funnel, and lead volume in one wireframe.
Sales, finance, HR, SaaS, and more — filter by team or search by metric.