Executive KPI Overview Dashboard Mockup Template
The Executive KPI Overview template is a one-page scorecard for executives and the consultants who brief them, built to show in a few seconds whether revenue, profit and growth are on plan and which business units need attention. It shows four headline KPIs with trends, monthly revenue against target, YTD attainment, business unit performance and key callouts.
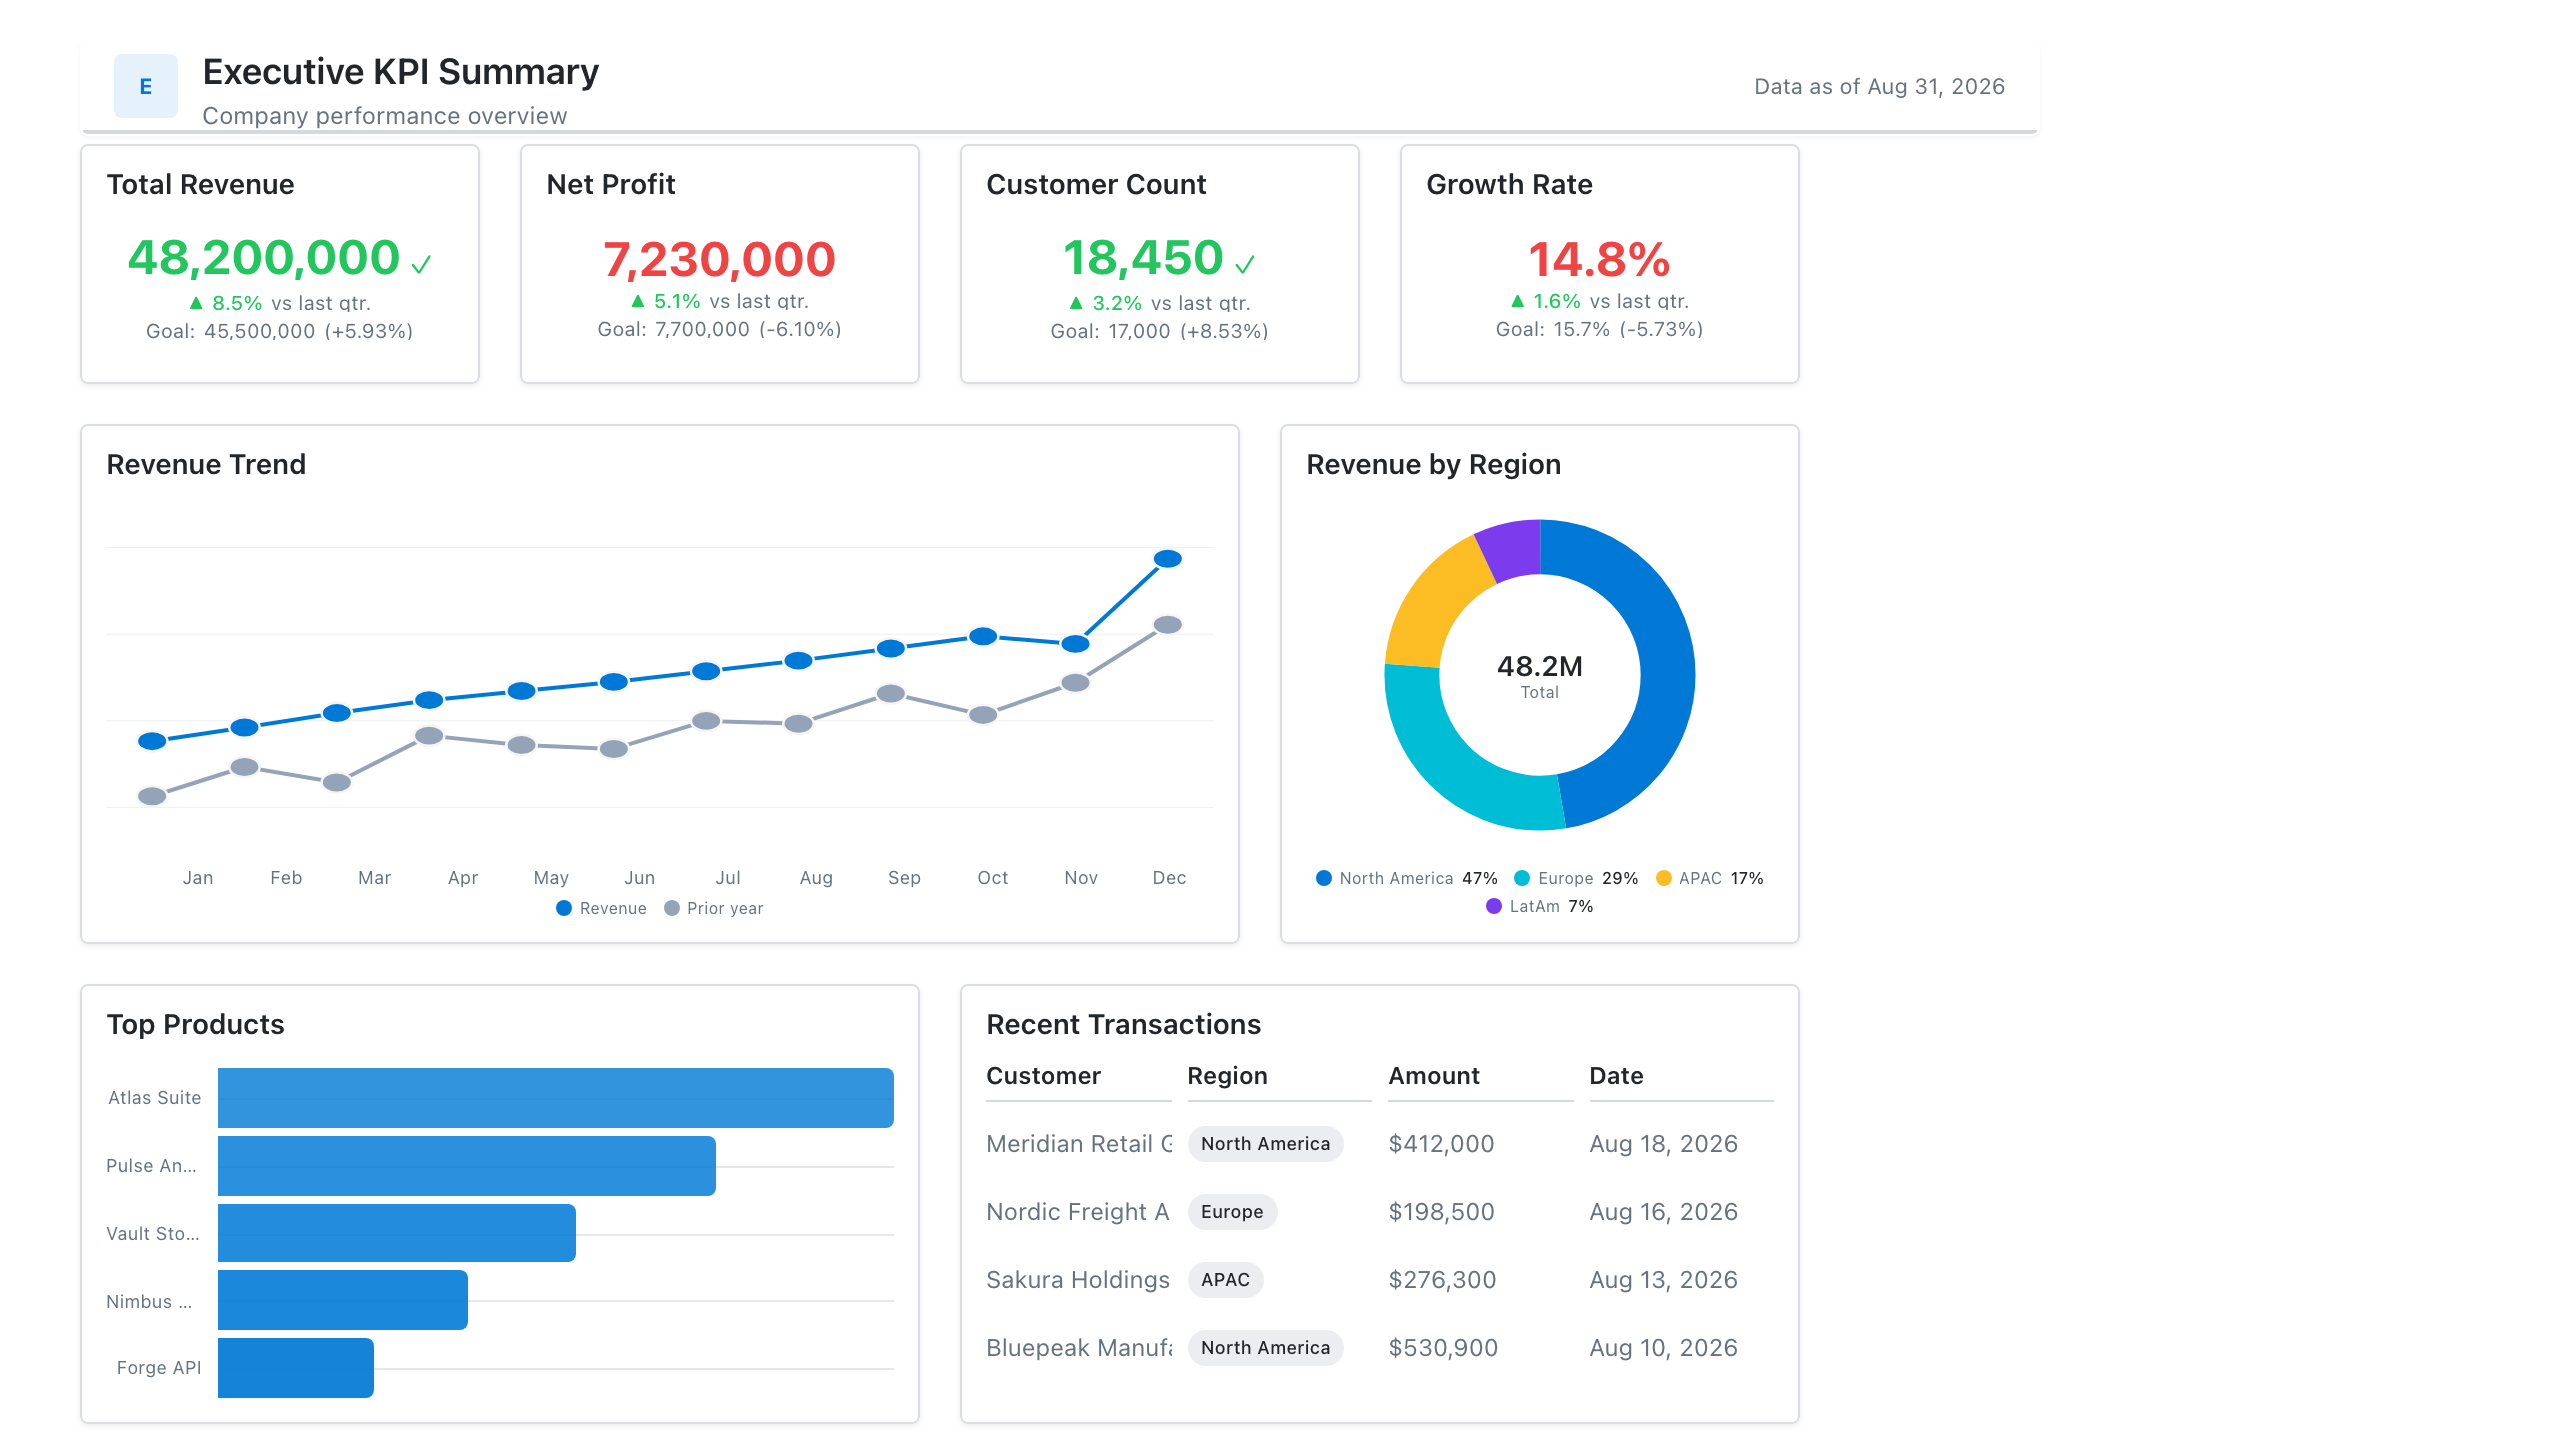
Click the mockup to open it full size
About this template
ExecutiveThe one-slide summary leadership actually reads: five or six headline KPIs with period-over-period deltas, a gauge against target, and a compact trend. Consultants use this as the opening artifact in a client engagement, before any deeper build.
Metrics this dashboard tracks
- Headline KPIs with deltas
- Performance vs. target (gauge)
- Trend sparklines
- Status by business unit
- Top risks / callouts
What's on the Executive KPI Overview dashboard?
| Section | What it shows | Why it's here |
|---|---|---|
| Header and filters Title card, three dropdown filters | The report title ("Executive KPI Scorecard"), the subtitle "Revenue, profit & growth at a glance", a data last updated timestamp, and filters for reporting period (last 12 months), business unit and currency. | Lets one scorecard serve every unit and currency, so the reader confirms the scope and data freshness before reading any number. |
| KPI row Four KPI cards, each with a sparkline | Revenue ($144.8M), net profit ($18.8M), active customers (48K) and revenue growth (9.4%), each compared with the prior year and each with a trend line. | Gives the four numbers leadership asks about first, with the change and direction on each, so the reader knows whether the business is moving the right way before reading further. |
| Target row Combo chart (columns and a line), gauge chart | Monthly revenue as columns against a target line from January to December, beside a gauge of YTD attainment (96.5%) on a 0 to 120% scale with a marker at 100% of plan. | Shows whether the year is on plan and whether any single month fell short, so the reader can tell a steady gap from one weak month. |
| Business unit and callouts row Table with shaded cells, text box with three bullets | A business unit table (North America, EMEA, APAC, Latin America, Corporate/Other) with revenue, margin, growth and percent of target, darker cells meaning stronger performance, beside three written callouts about APAC, EMEA and Corporate/Other. | Breaks the total down by unit and then says in words what the numbers mean, so the reader leaves with the exceptions already named. |
What each metric means
Revenue
- Definition: Total income from sales of goods and services in the period, before costs are deducted. Recognition rules follow the company's accounting policy.
- Formula:
Revenue = sum of recognized revenue in the period - Why it matters: It is the top-line measure of the size of the business and the base for growth and target tracking.
- Why a KPI card with sparkline: The headline figure with a change versus the prior year and a sparkline shows level, change and direction in one tile.
Net profit
- Definition: Revenue minus all costs, including operating costs, interest and taxes, for the period.
- Formula:
Net profit = revenue - total costs and expenses (including interest and tax) - Why it matters: It shows how much of revenue the business keeps, which revenue alone does not.
- Why a KPI card with sparkline: Placed beside revenue in the same card format, it can be compared with revenue at a glance.
Active customers
- Definition: The number of customers who bought or used the product in the period. The activity rule (for example a purchase in the last 12 months) is set by each company.
- Formula:
Active customers = count of distinct customers meeting the activity rule in the period - Why it matters: It shows whether revenue growth is backed by a growing customer base.
- Why a KPI card with sparkline: A single count with a prior-year change and a trend line suits a figure that moves steadily.
Revenue growth
- Definition: The percentage change in revenue compared with the same period a year earlier.
- Formula:
Revenue growth = (current revenue - prior-year revenue) / prior-year revenue x 100 - Why it matters: It shows how fast the business is growing and whether growth is speeding up or slowing.
- Why a KPI card with sparkline: A rate shown with its own prior-year value and a trend line makes it easy to see if growth is accelerating.
Monthly revenue vs target
- Definition: Revenue for each month shown against that month's target, so the reader sees which months met plan.
- Formula:
Monthly variance = monthly revenue - monthly target - Why it matters: It shows whether a shortfall is one weak month or a continuing pattern.
- Why a combo chart: Columns show the amount earned each month and a line shows the target on the same scale, so the gap is visible month by month.
YTD attainment
- Definition: Revenue earned so far in the year as a percentage of the target for the same period. The gauge marks 100% as plan.
- Formula:
YTD attainment = year-to-date revenue / year-to-date target x 100 - Why it matters: It gives one number for how the year is tracking against plan.
- Why a gauge chart: A gauge shows one value on a scale with a marker at plan, so the reader sees at once whether the result is below, at or above target.
Business unit performance
- Definition: Revenue, margin, growth and percent of target for each business unit, with cell shading that is darker for stronger performance on each measure.
- Formula:
Percent of target = unit revenue / unit target x 100 - Why it matters: It shows which units drive the total and which are behind, so attention goes to the right place.
- Why a table with shaded cells: A table keeps exact values for four measures per unit in one row, and shading lets the reader scan for strong and weak cells.
Key callouts
- Definition: Three short written statements that name the most important findings from the numbers, such as a unit ahead of plan or one that trails it.
- Why it matters: It tells the reader what to take from the table, so the meeting starts with the findings rather than the search for them.
- Why a text box: Plain bullets carry judgments and context that a chart cannot, and sit beside the table they explain.
Data you need to build this
- Finance system or general ledger Period, Business unit, Revenue, Costs and expenses, Net profit, Currency
- Planning or budget sheet Period, Business unit, Revenue target, Margin target
- CRM or billing system Customer ID, Business unit, Activity date or last purchase date, Status
- Exchange rate table Date, From currency, To currency, Rate
Why it's laid out this way
- The four KPI cards come first and each carries a prior-year change and a sparkline, so level, change and direction are readable in the first seconds, as an executive dashboard is meant to be.
- The middle row answers whether the year is on plan. The combo chart shows each month against target, and the gauge summarises the year to date as one number with a marker at 100%.
- The bottom row moves from summary to cause. The shaded table shows which business units drive the result, and the callouts beside it state the three findings in words, so the reader does not have to work them out from the table.
Last updated:
More like this
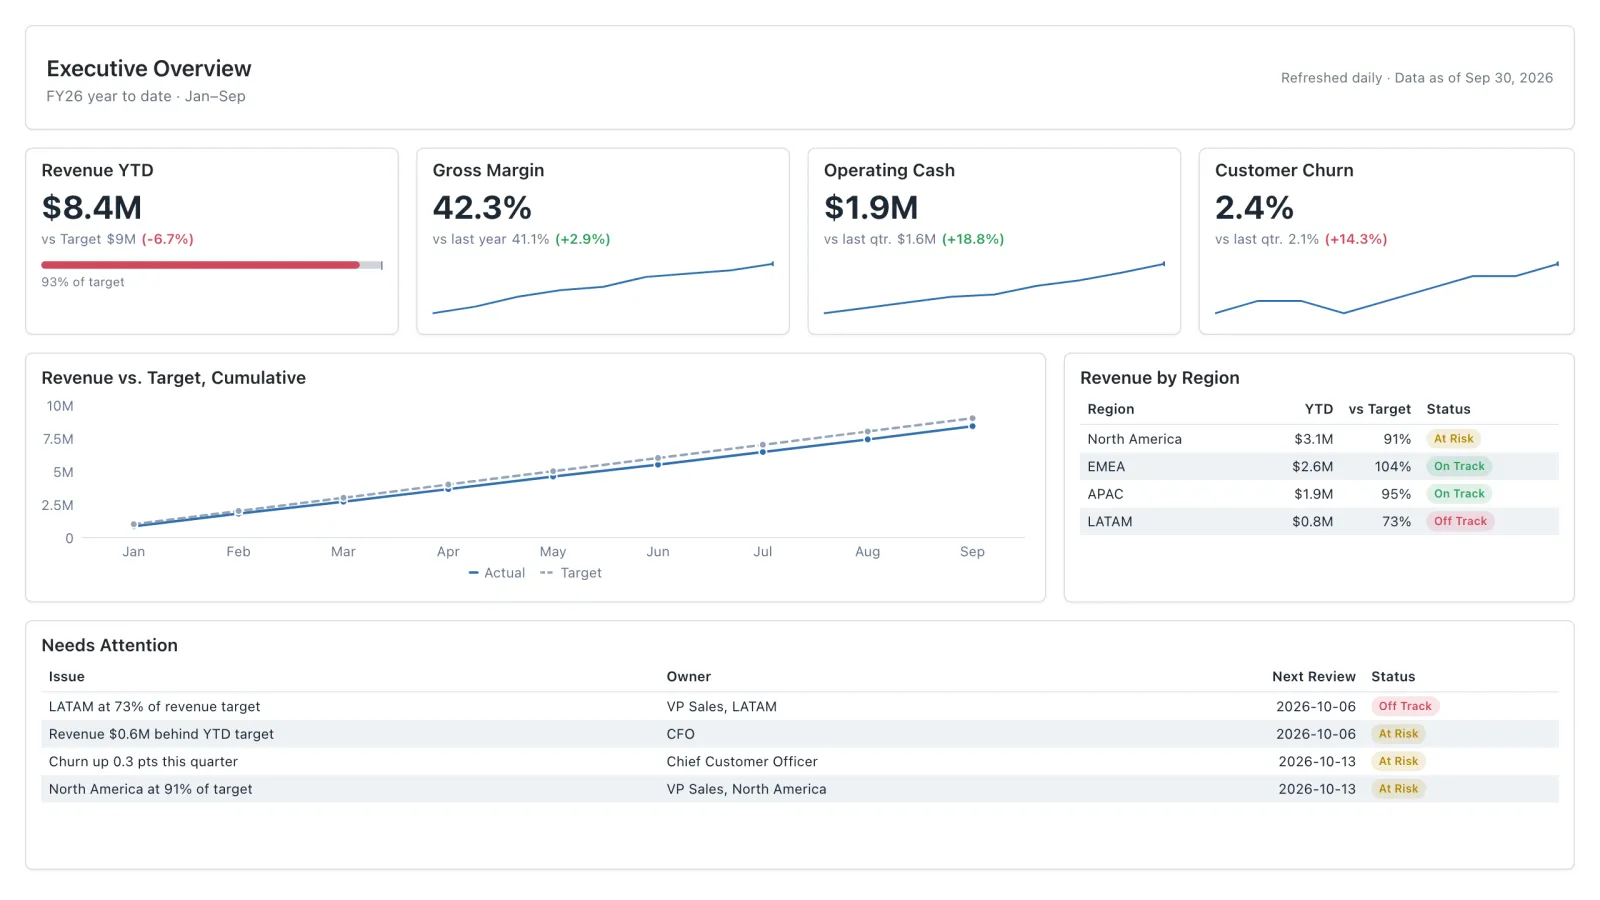
Executive
Four headline KPIs against target, one revenue trend, and the exceptions leadership needs to act on, all on one page.
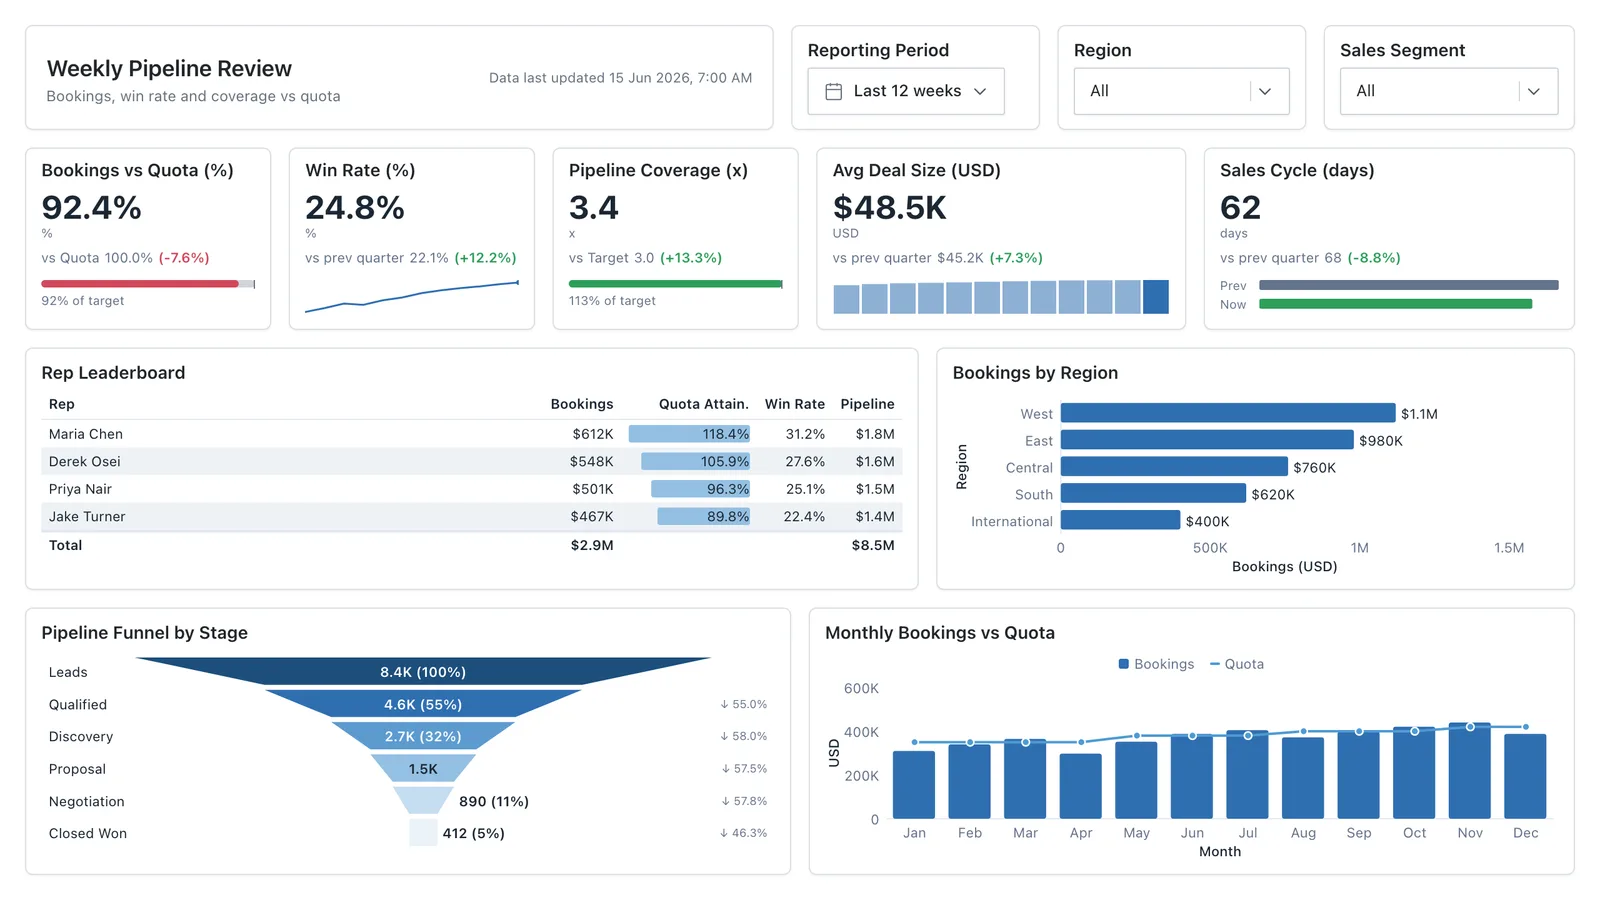
Sales Performance
Revenue, win rate, pipeline value, and rep performance across regions — the layout most sales teams build first.
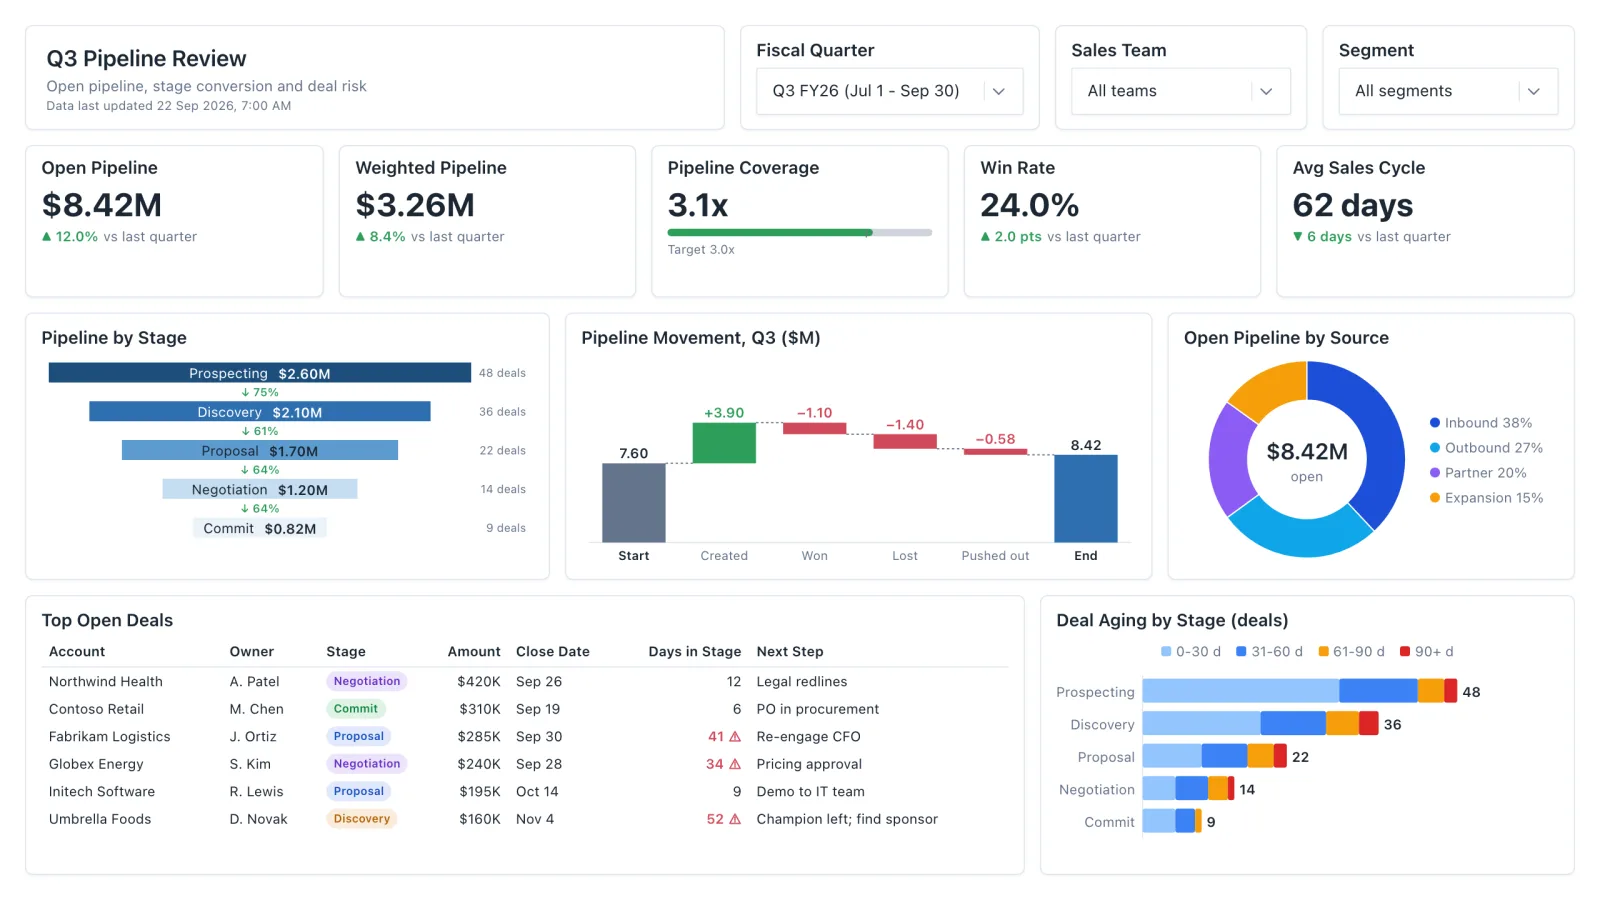
Sales Pipeline
Sales pipeline dashboard with open and weighted pipeline, coverage vs target, a stage funnel and stale-deal flags.
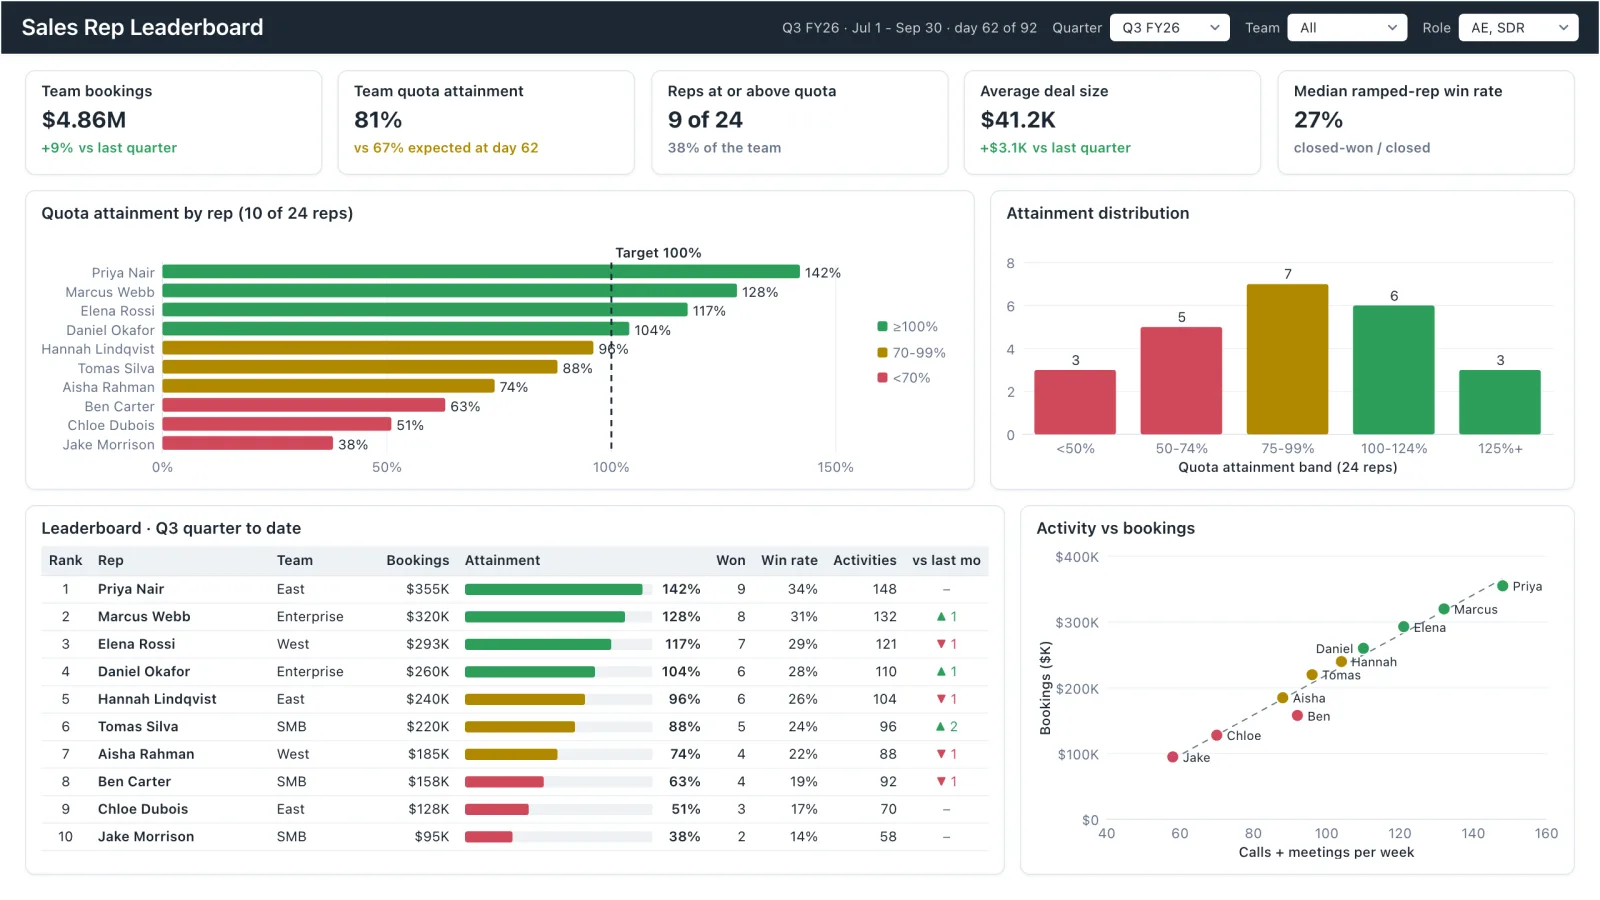
Sales Rep Leaderboard
Sales rep dashboard example with quota attainment by rep, a ranked leaderboard table and activity vs bookings.
Sales, finance, HR, SaaS, and more — filter by team or search by metric.