Fact Table vs. Dimension Table
Also called: Fact and dimension tables, Facts and dimensions
A fact table records events and their numbers, like orders and revenue. A dimension table describes the things involved, like products, dates and regions.
Also called: Fact and dimension tables, Facts and dimensions
A fact table records events and their numbers, like orders and revenue. A dimension table describes the things involved, like products, dates and regions.
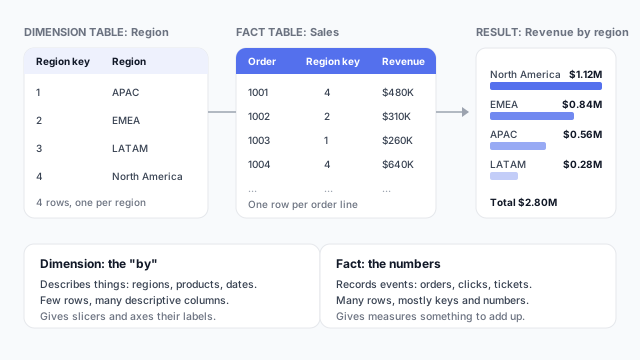
A report answers questions of the form “how much, by what?”. The fact table holds the “how much”: revenue, quantity, tickets, hours. The dimension tables hold the “by what”: by region, by product, by month, by customer segment.
In the example, the Sales fact table has one row per order line, with a Region key and a Revenue value. The Region dimension table has four rows, one per region. Group Revenue by region and you get North America $1.12M, EMEA $0.84M, APAC $0.56M and LATAM $0.28M, which add up to $2.80M.
| Fact table | Dimension table | |
|---|---|---|
| A row is | An event or measurement | A thing or category |
| Examples | Sales, web visits, tickets | Date, Product, Region, Customer |
| Size | Many rows (grows over time) | Few rows (changes slowly) |
| Columns | Keys to dimensions, plus numbers | A key, plus descriptive text |
| Role in a report | Supplies values for measures | Supplies axes, legends, slicers, filters |
Look at any visual and sort its fields. The field you sum or count (Revenue) comes from a fact table. The fields on the axis, legend, rows or in a slicer (Region, Month, Category) come from dimensions. If a slicer is built on a column in the fact table, it often means a dimension is missing.
Facts and dimensions together form a star schema, related through one-to-many relationships.
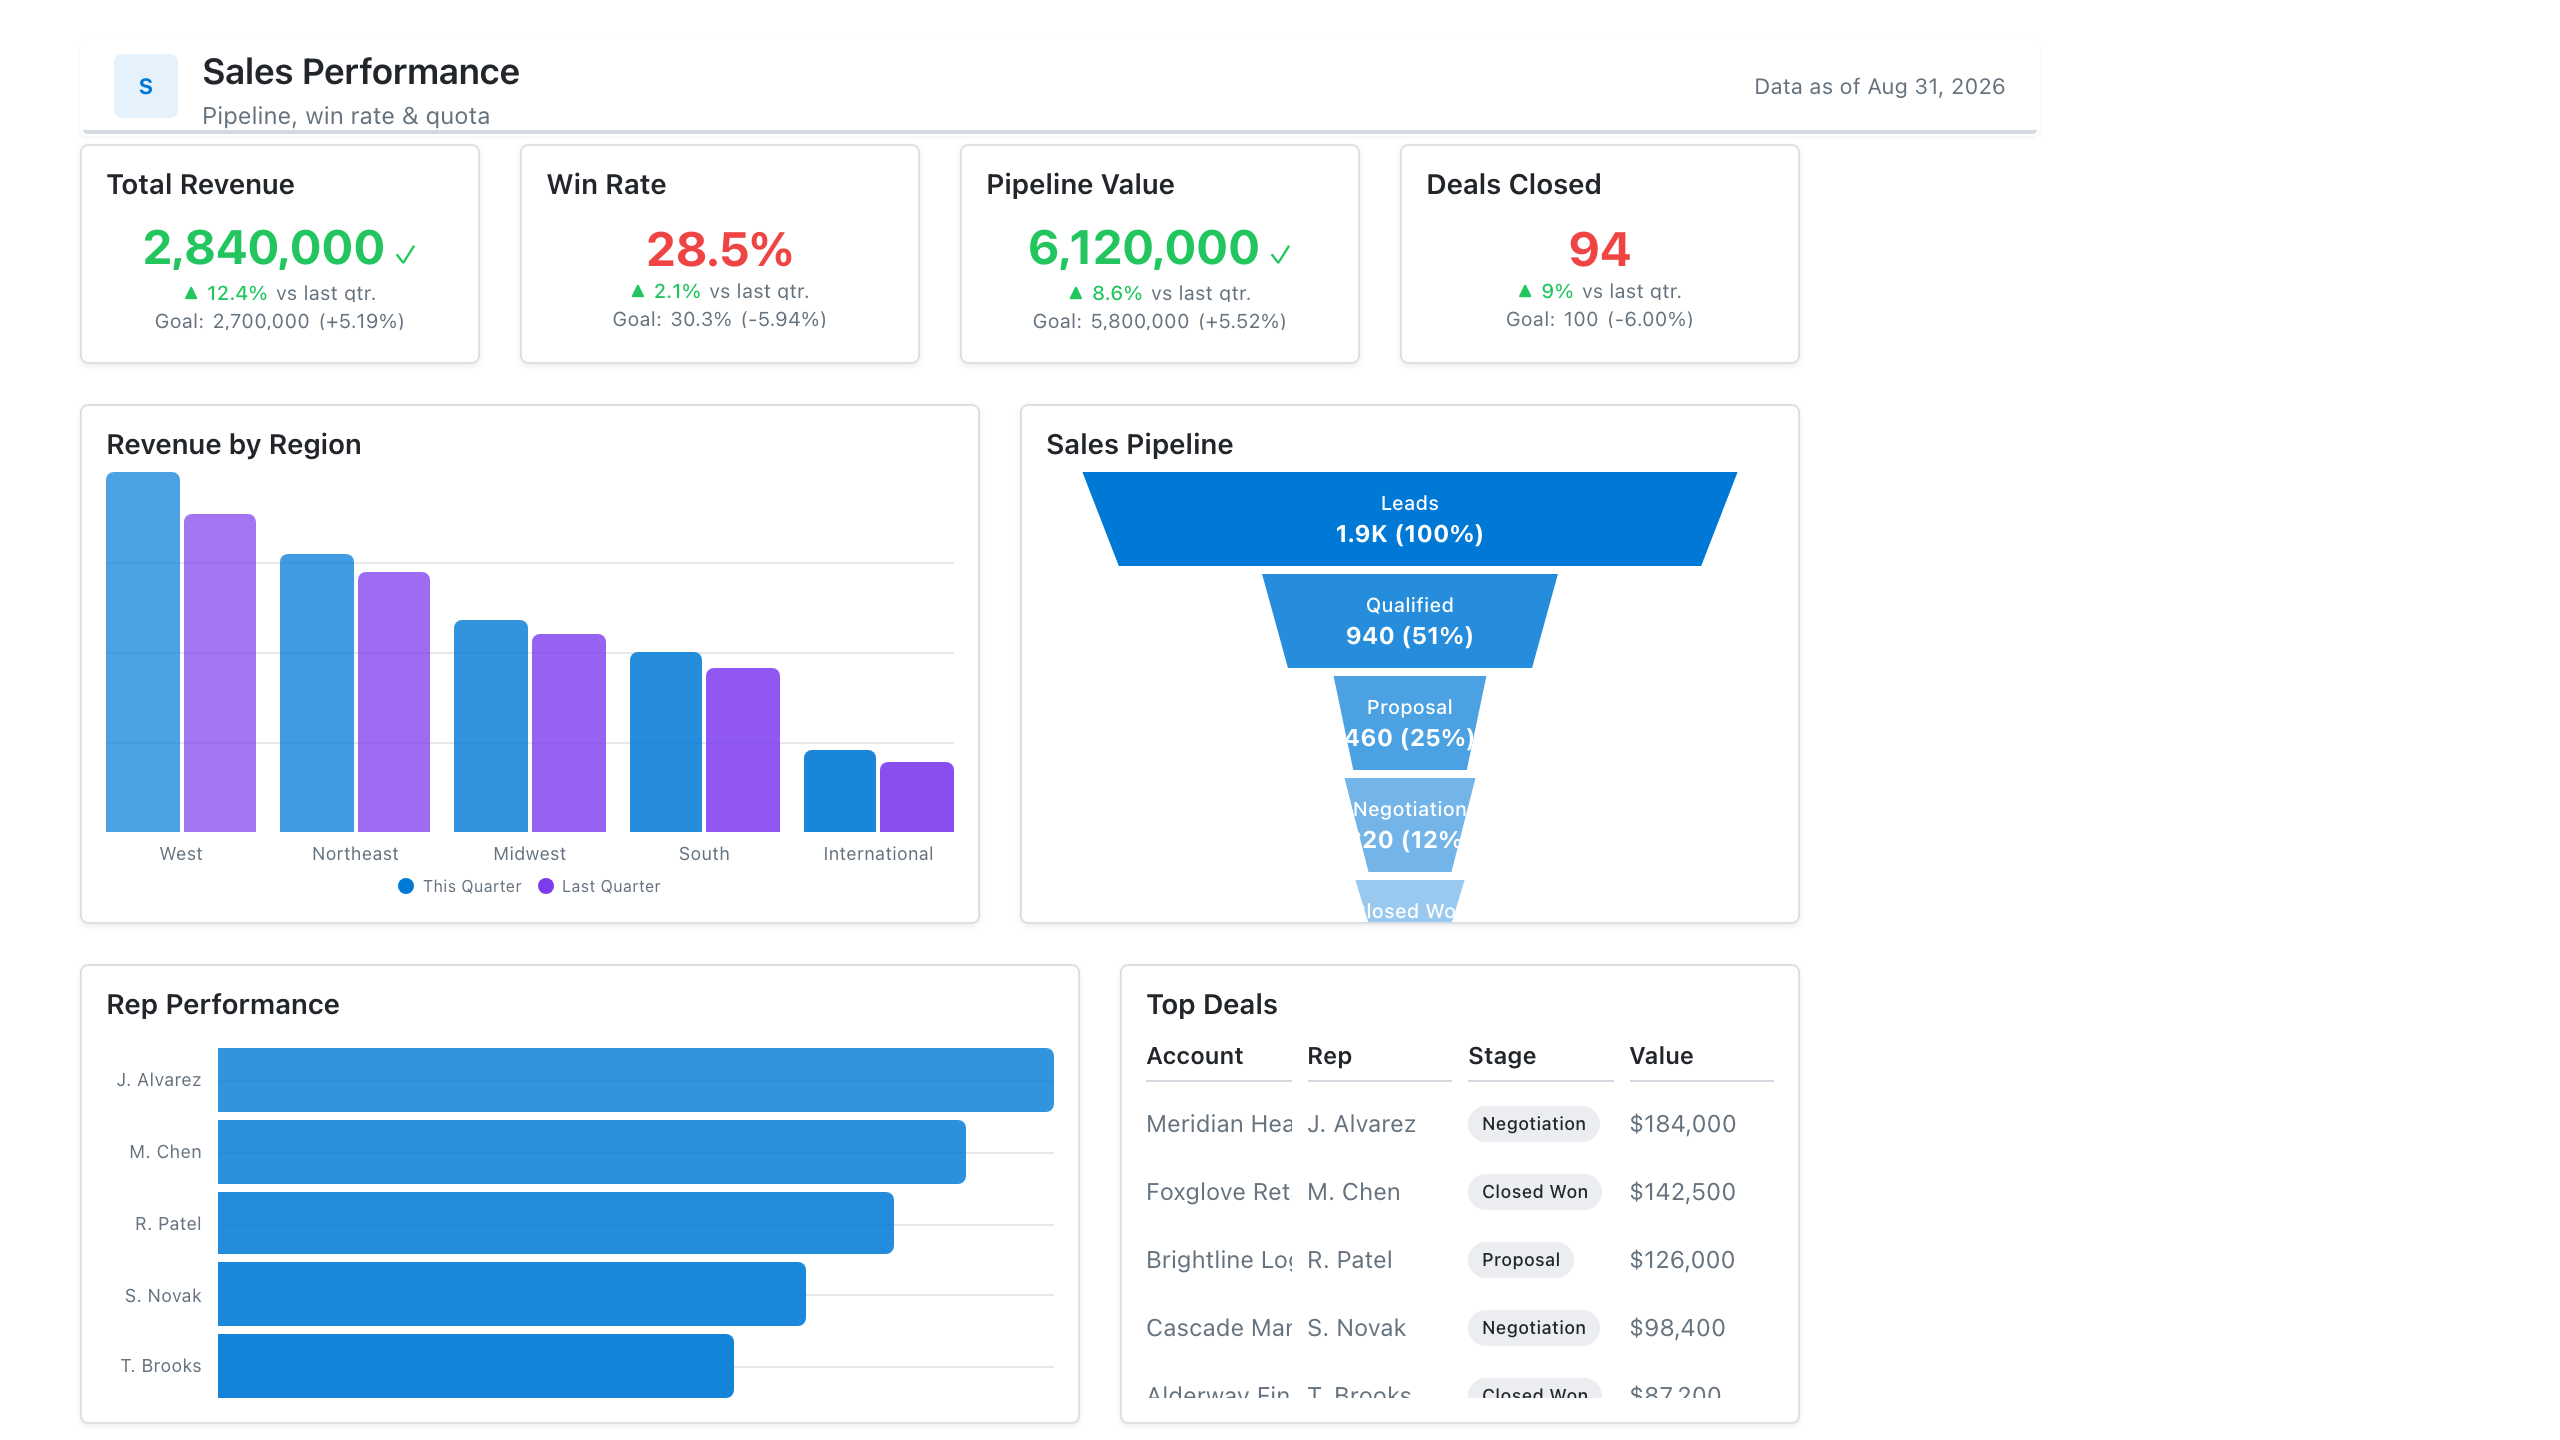
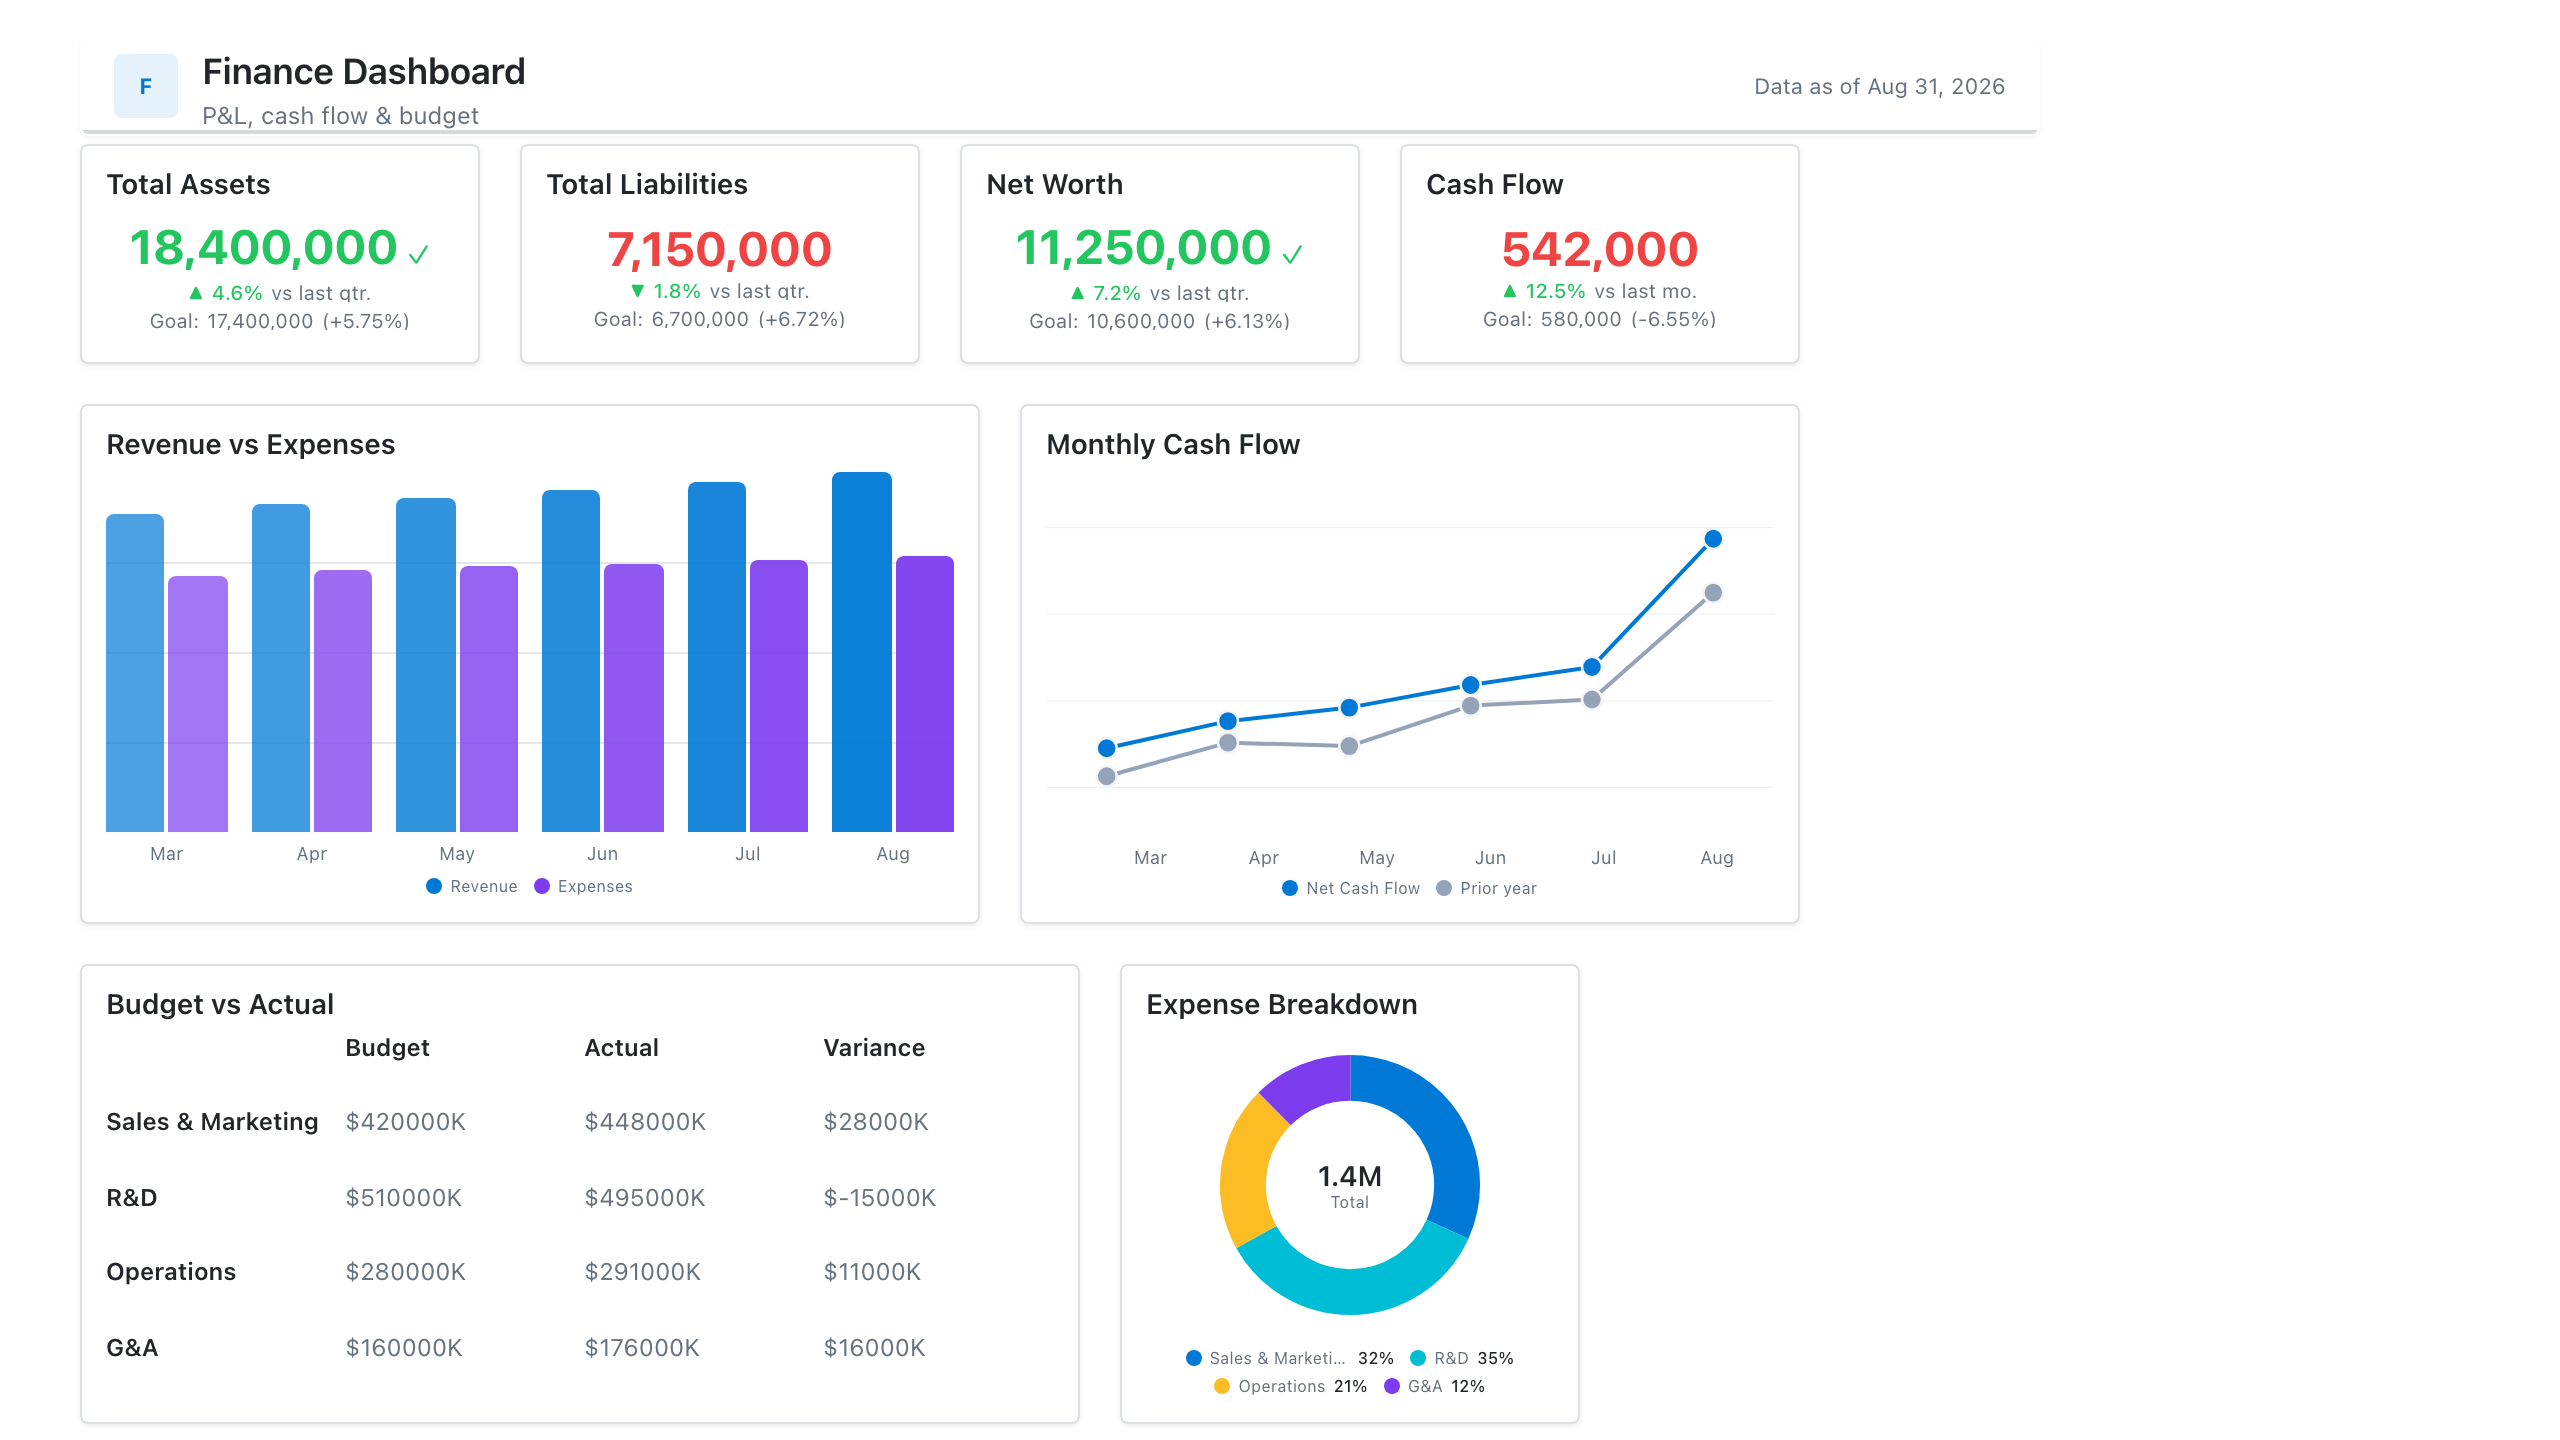
Reading a mockup this way is a fast model check: the numbers on cards and bars are facts, and the filters and axes are dimensions. List them before building, and the model nearly designs itself. See wireframing best practices.
These free Mockko templates use it. Open one and edit it in your browser.
Lay out your Power BI or Tableau dashboard in Mockko, get sign-off, then build. Free to start.
Try Mockko free