Financial Dashboard Mockup Template
The Financial dashboard template is a one-page monthly close layout for CFOs and finance teams, built to decide whether the month landed on budget and which lines or departments need an explanation. It shows revenue, gross margin, operating expenses, net income and cash, a P&L actual-versus-budget table, a net margin gauge and department spend.
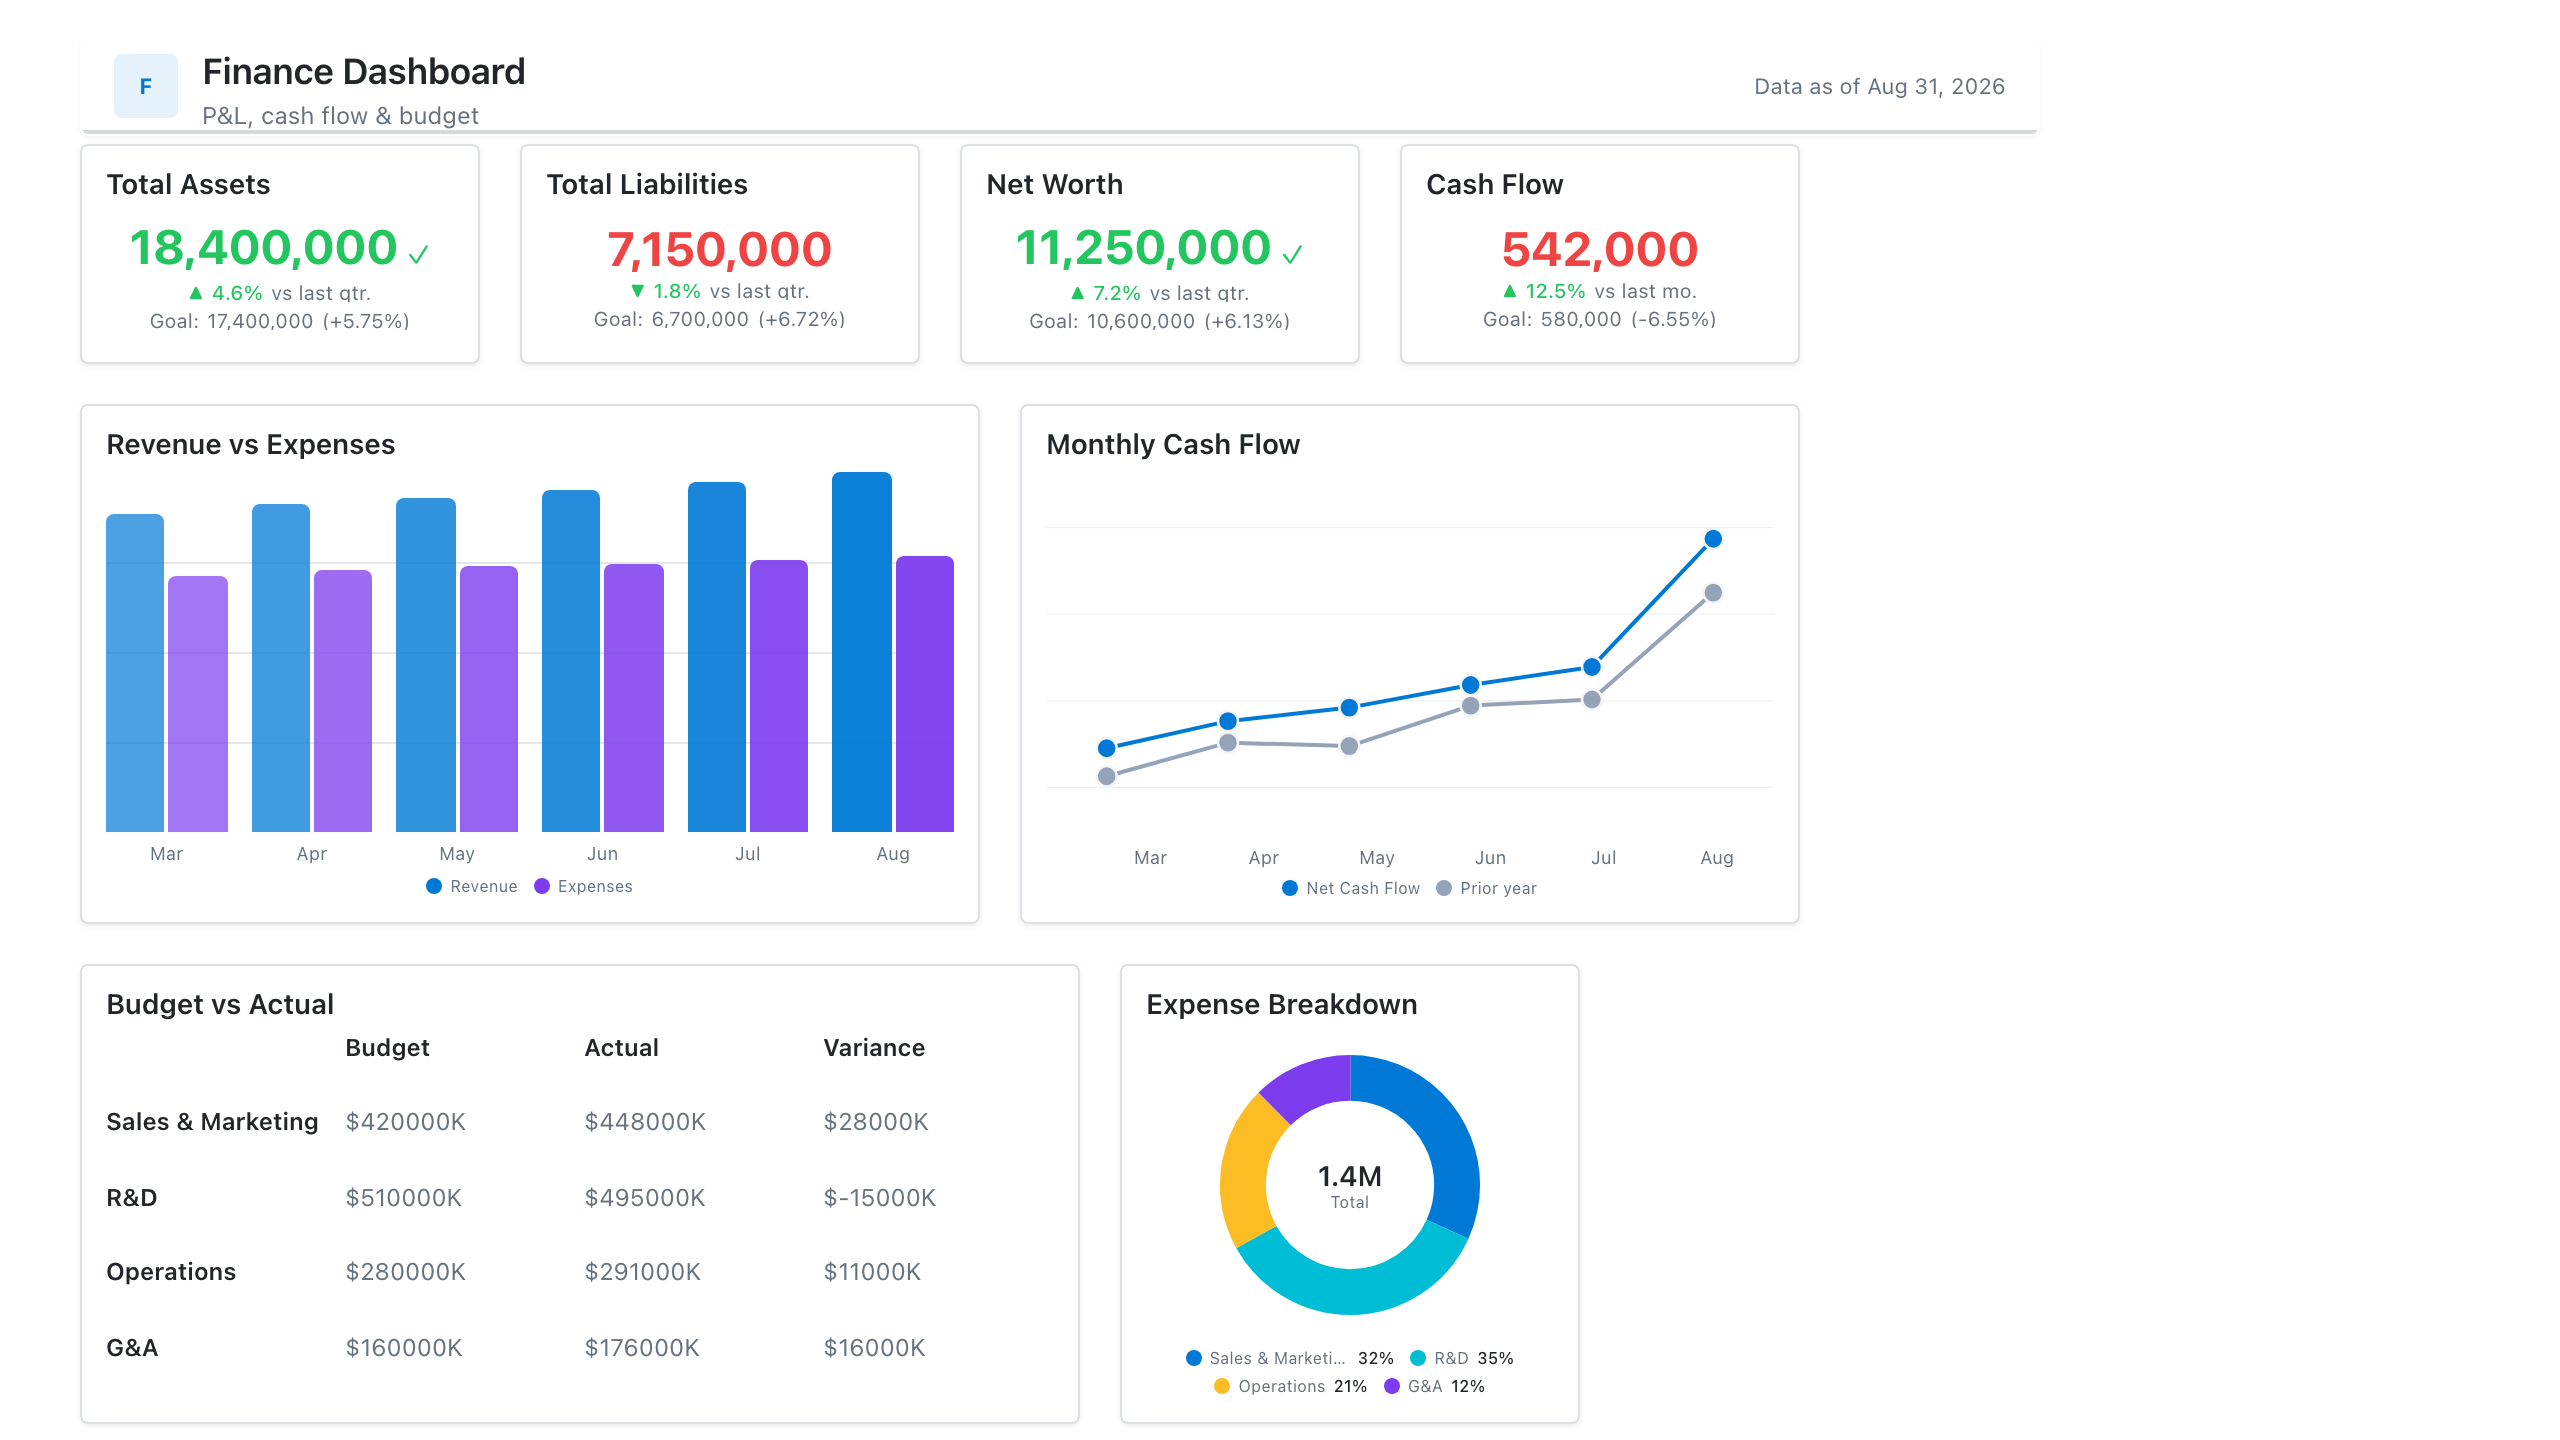
Click the mockup to open it full size
About this template
FinanceA finance-team layout covering the monthly close: a P&L actual-vs-budget table, revenue and net-margin trend, budget-vs-actual opex by department, and headline margin KPIs. Wireframe the structure here so the Power BI build starts with the measures already scoped.
Metrics this dashboard tracks
- Revenue, COGS, gross & net margin
- P&L actual vs. budget
- Net margin trend
- Budget vs. actual by department
- Operating expense breakdown
- Runway / burn
What's on the Financial dashboard?
| Section | What it shows | Why it's here |
|---|---|---|
| Header and filters Title card, reporting period date picker, two dropdown filters | The title ("Monthly Close Dashboard"), the subtitle "CFO view of P&L actuals vs budget", a data last updated date, and filters for reporting period (with the comparison period shown beneath), entity and department. | Fixes the period, legal entity and department before any number is read, so the reader knows exactly which close the figures belong to and how fresh they are. |
| KPI row Five KPI cards, three with target bars and two with sparklines | Revenue, gross margin %, operating expenses, net income and cash on hand. Revenue, gross margin and operating expenses show a value against budget with a Target bar and a Now bar. Net income and cash on hand show a change versus the prior month with a small trend line. | Gives the headline answer first: the three P&L figures that have a budget are judged against it, and the two that are judged by direction (profit and cash) show their recent path. |
| P&L summary and margin gauge Table with colour-shaded variance column, gauge chart | A P&L table with revenue, cost of goods sold, gross profit, operating expenses and operating income, each with actual, budget, variance in dollars and variance in percent, shaded by size. Beside it, a gauge of net margin % against a goal on a 0 to 25 percent scale. | The table shows which line created the gap between actual and budget, and the gauge shows whether profitability is on its goal, so the reader knows where to ask questions first. |
| Trend and department spend row Combo chart (columns and line), clustered column chart | Monthly revenue as columns with net margin % as a line over the last eleven months, and operating expenses by department (sales, marketing, G&A, R&D, IT) as budget and actual column pairs with value labels. | Puts this month in the context of the trend, so one-off swings are separated from drift, and shows which department explains the operating expense variance. |
What each metric means
Revenue
- Definition: Income from sales of goods and services recognised in the period, before costs are deducted. Recognition follows each company's accounting policy.
- Why it matters: It is the top line against which every cost and margin is judged, and the first figure compared with budget.
- Why a KPI card: One large figure with a budget comparison and Target and Now bars shows the result and the gap to plan without any reading of axes.
Gross margin %
- Definition: The share of revenue left after the direct cost of the goods or services sold. What counts as cost of goods sold varies by company and industry.
- Formula:
Gross margin % = (revenue - cost of goods sold) / revenue - Why it matters: It shows whether pricing and direct costs are holding, before overheads are considered.
- Why a KPI card: A single percentage next to its budget value and a Target and Now bar shows whether the margin is above or below plan at a glance.
Operating expenses
- Definition: Costs of running the business that are not direct cost of goods sold, such as sales, marketing, general and administrative, research and IT spend.
- Formula:
Operating expenses = sum of departmental operating costs in the period - Why it matters: It is the cost line a finance team can most directly influence, and overspend against budget here reduces operating income.
- Why a KPI card: The card is coloured differently from the revenue and margin cards, because a number above budget is unfavourable for a cost, which a plain number would not signal.
Net income
- Definition: Profit after all expenses, interest and taxes for the period. It is the bottom line of the income statement.
- Formula:
Net income = revenue - all expenses (including interest and taxes) - Why it matters: It is the final profit figure, and its trend shows whether the business is becoming more or less profitable.
- Why a KPI card with sparkline: The sparkline under the figure shows the recent direction, which matters more for profit than a comparison with a single budget number.
Cash on hand
- Definition: The cash and cash equivalents held at the end of the period, usually taken from the balance sheet. It is a point-in-time balance, not a flow.
- Why it matters: Profit and cash can diverge, so this shows whether the business can fund its obligations.
- Why a KPI card with sparkline: A balance that is read by its direction suits a filled sparkline beside the headline value and change versus the prior month.
P&L variance
- Definition: The difference between actual and budget for each P&L line, in currency and as a percent of budget. Sign conventions vary: some teams show favourable variances as positive for both income and costs, others show actual minus budget, so state which one you use.
- Formula:
Variance = actual - budget; Variance % = variance / budget - Why it matters: It shows which lines drove the gap between the result and the plan, so the explanation can start there.
- Why a table: A table keeps the exact values and the line-item order of a P&L, and the colour shading on the variance column marks the largest gaps.
Net margin % vs goal
- Definition: Net income as a share of revenue, compared with a profitability goal set by the company.
- Formula:
Net margin % = net income / revenue - Why it matters: It expresses profit relative to size, so months with different revenue can be compared and judged against one goal.
- Why a gauge chart: A single measure against one goal on a fixed 0 to 25 percent scale suits a gauge, with the goal marked on the arc.
Monthly revenue and net margin trend
- Definition: Revenue per month shown as columns with net margin % over the same months as a line on a second axis.
- Why it matters: It shows whether this month is unusual or part of a pattern, and whether margin moves with revenue.
- Why a combo chart: Columns suit a currency amount per month and the line suits a percentage, so both can share the same months on separate axes.
Operating expenses: budget vs actual by department
- Definition: Budgeted and actual operating spend for each department in the period.
- Formula:
Department variance = actual spend - budgeted spend - Why it matters: It locates overspend, so a conversation about the operating expenses card can be directed at a named department.
- Why a clustered column chart: Paired columns per department make budget and actual directly comparable, and value labels give the exact figures.
Data you need to build this
- General ledger or ERP (NetSuite, SAP, QuickBooks, Xero or similar) Account, Account type or P&L line (revenue, COGS, operating expense), Period, Amount (actual), Entity, Department or cost centre, Currency
- Budget or planning system (Excel, Adaptive, Anaplan or similar) Account or P&L line, Period, Budget amount, Entity, Department or cost centre, Version
- Balance sheet or bank balances Cash and cash equivalents balance, Period end date, Entity
- Targets table Net margin goal, Gross margin target, Period
Why it's laid out this way
- The five KPI cards lead the page so the first question, whether the month is on budget, is answered before any table is read. The three cards that have a budget carry Target and Now bars, and the two judged by direction carry a sparkline.
- The P&L table and the gauge share the second row. The table is the wider element because a P&L has many lines to compare, and the gauge is narrow because it carries one figure against one goal.
- The bottom row moves from the whole company to its parts: a combo chart shows the trend across months, and the department columns show where operating spend sits against budget, so the reader goes from total to cause.
Last updated:
More like this
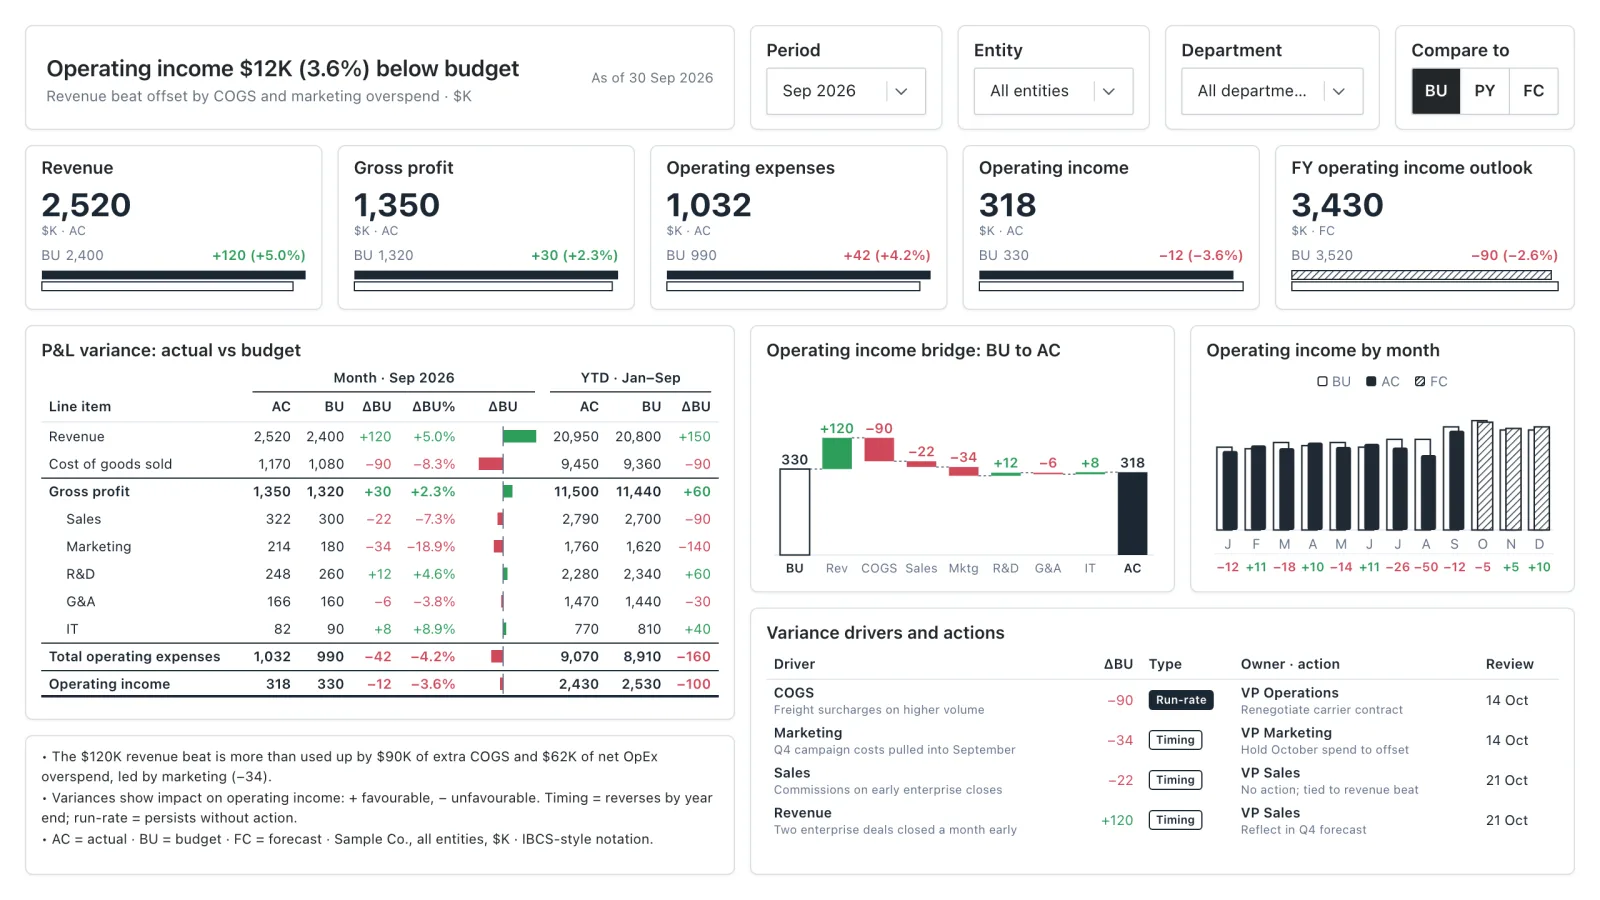
Budget vs Actual Variance
An IBCS-style variance report: P&L actual vs budget, an operating income bridge, and the drivers behind every gap.
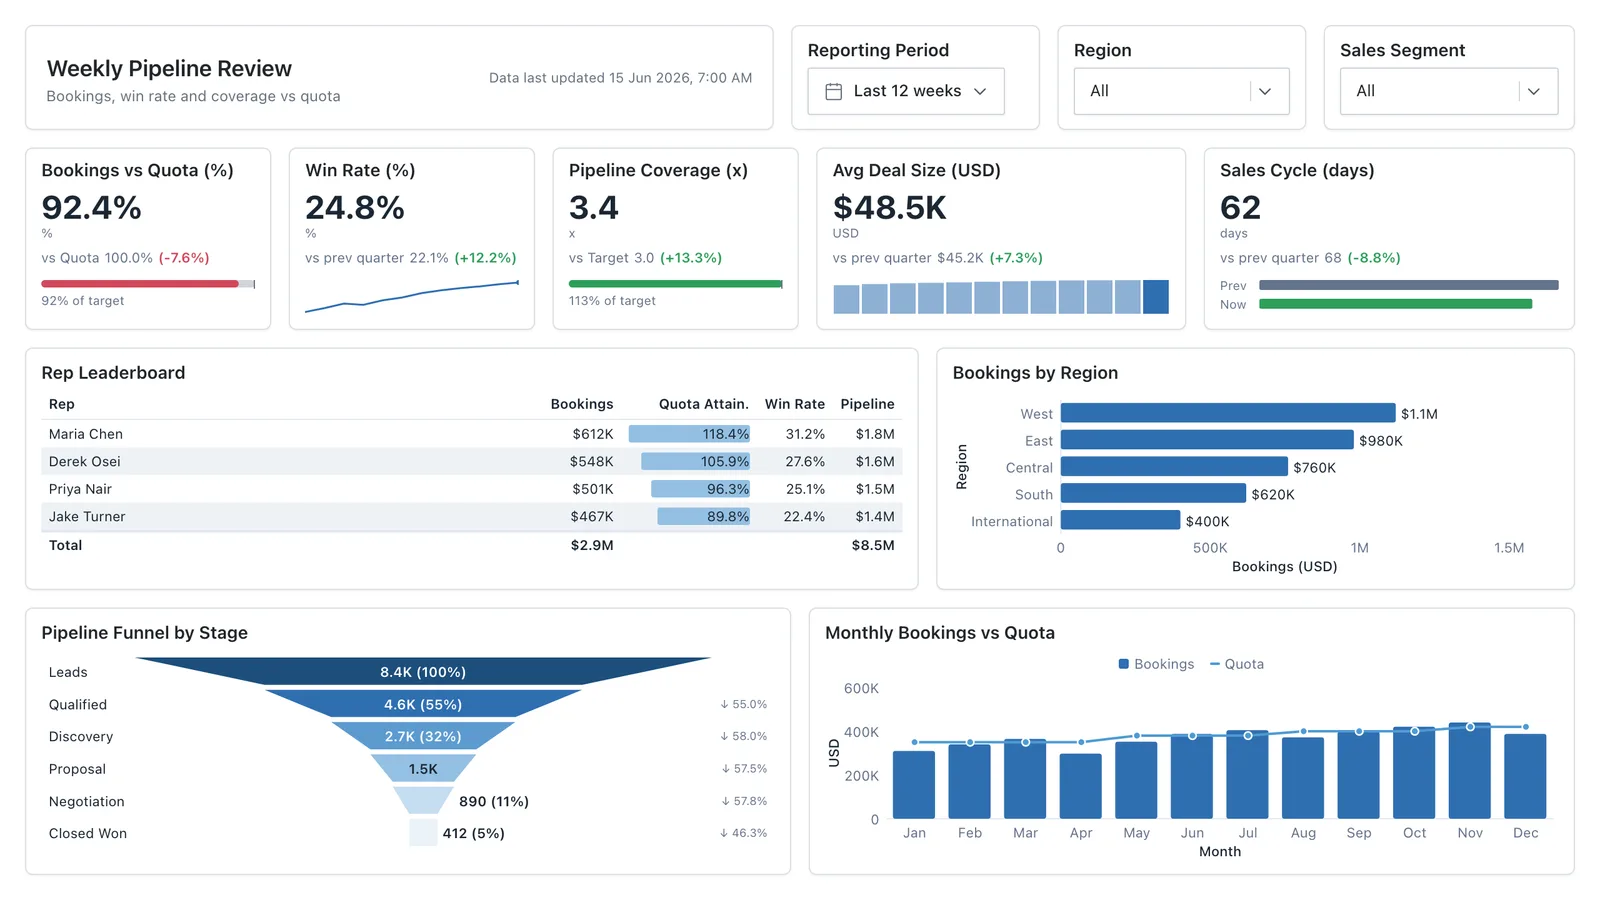
Sales Performance
Revenue, win rate, pipeline value, and rep performance across regions — the layout most sales teams build first.
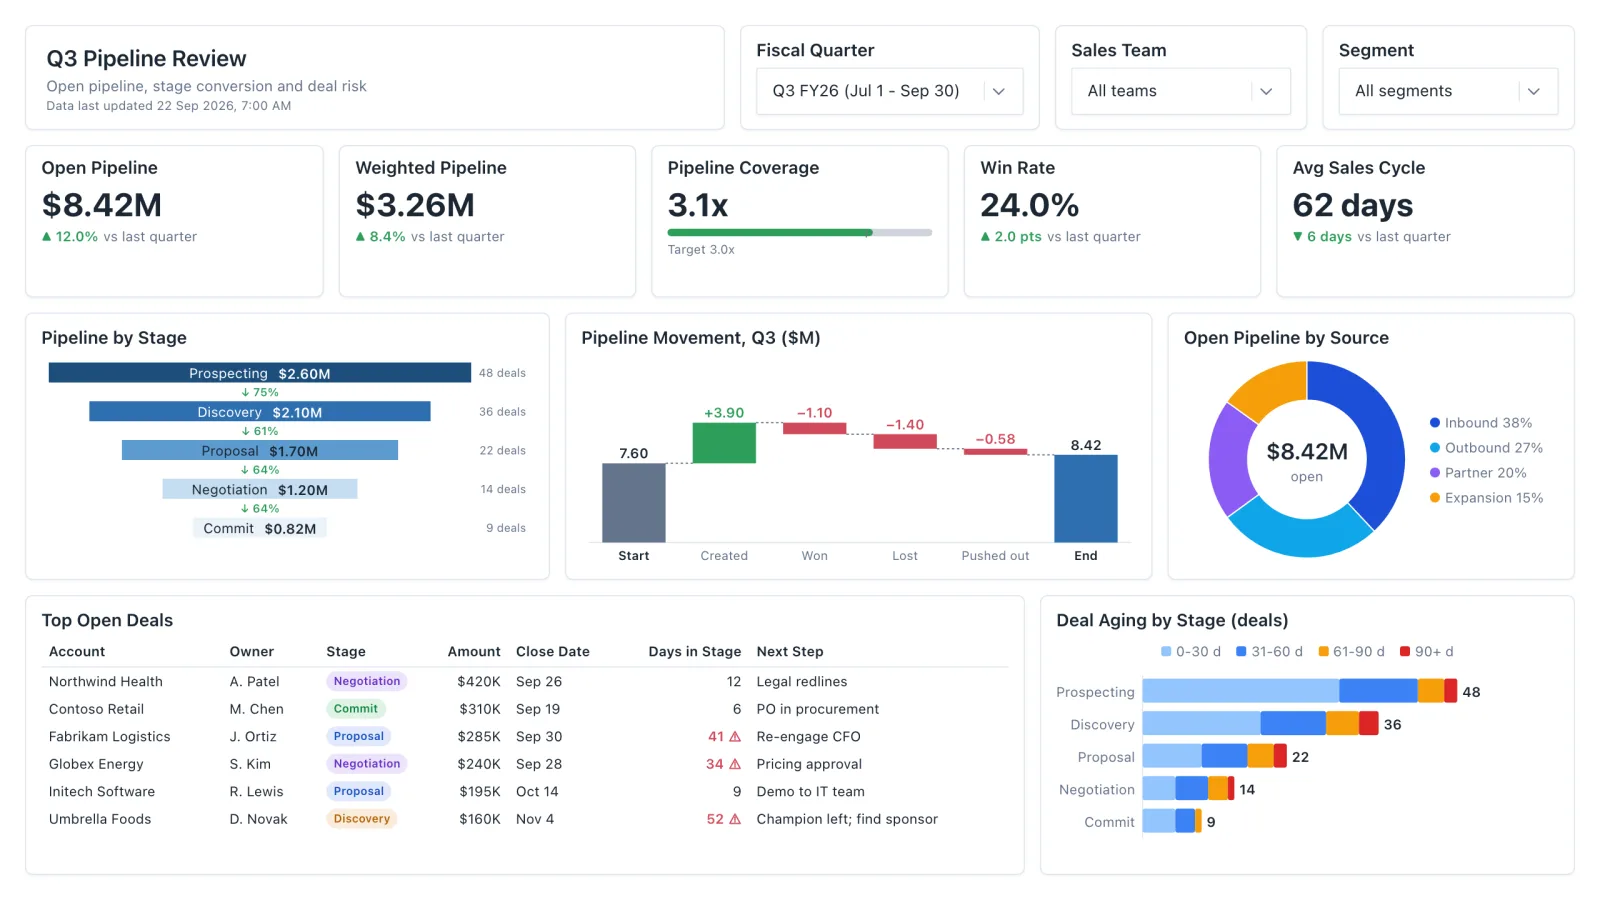
Sales Pipeline
Sales pipeline dashboard with open and weighted pipeline, coverage vs target, a stage funnel and stale-deal flags.
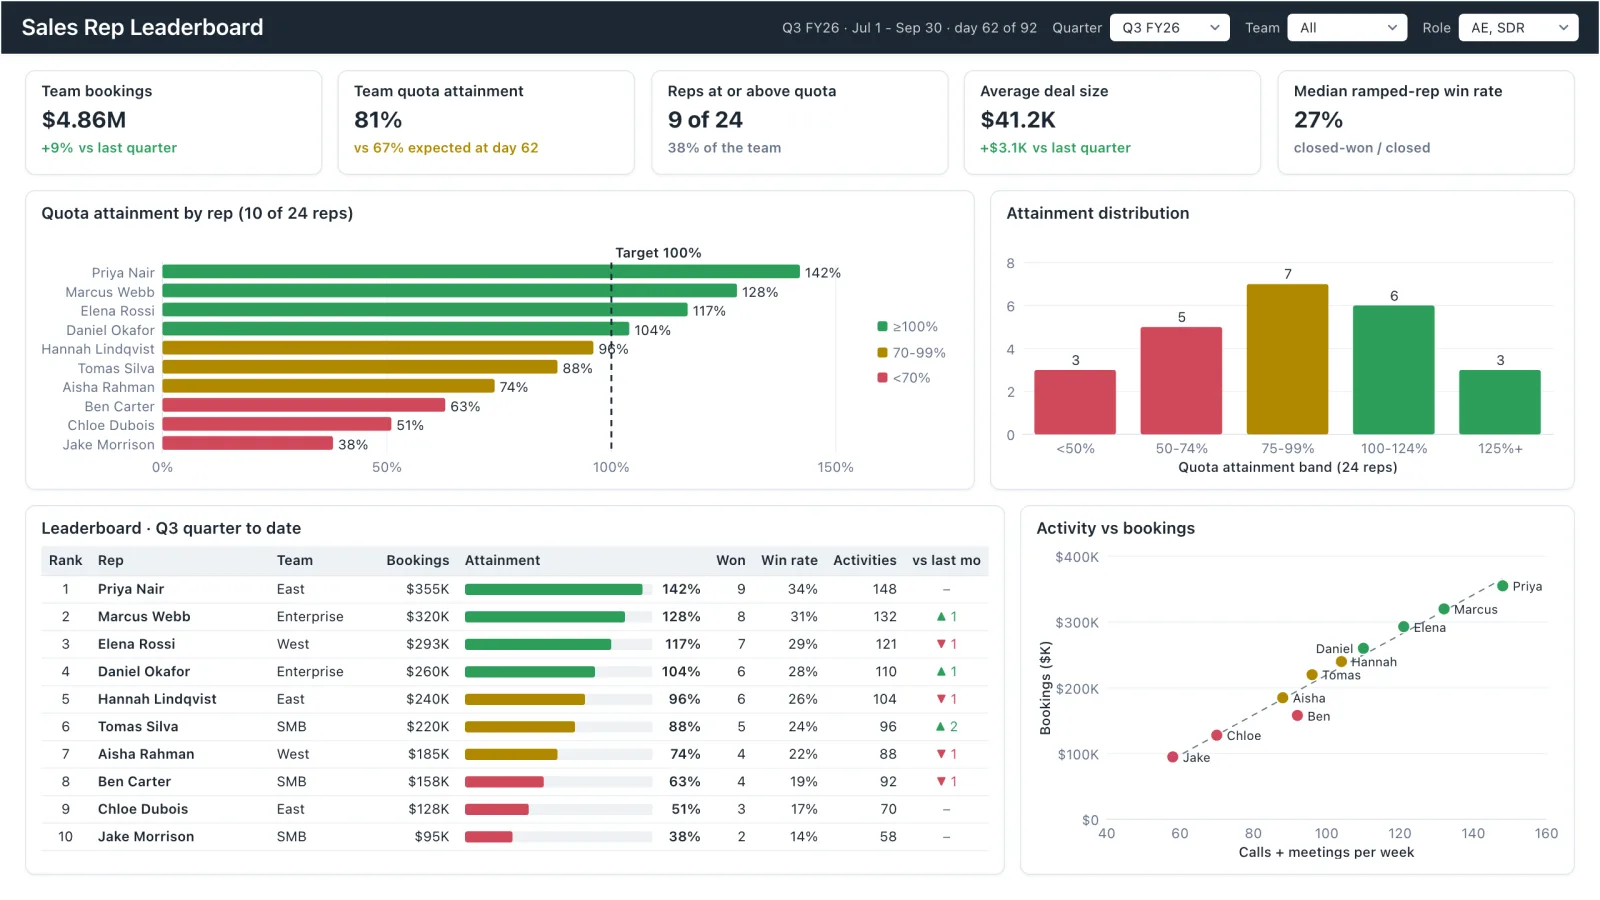
Sales Rep Leaderboard
Sales rep dashboard example with quota attainment by rep, a ranked leaderboard table and activity vs bookings.
Sales, finance, HR, SaaS, and more — filter by team or search by metric.