Sales Performance Dashboard Mockup Template
The Sales Performance dashboard template is a one-page layout for sales leaders and sales operations analysts, built to decide whether the team is on track against quota and which reps, regions or stages need attention. It shows bookings versus quota, win rate, pipeline coverage, a rep leaderboard, bookings by region and monthly bookings against quota.
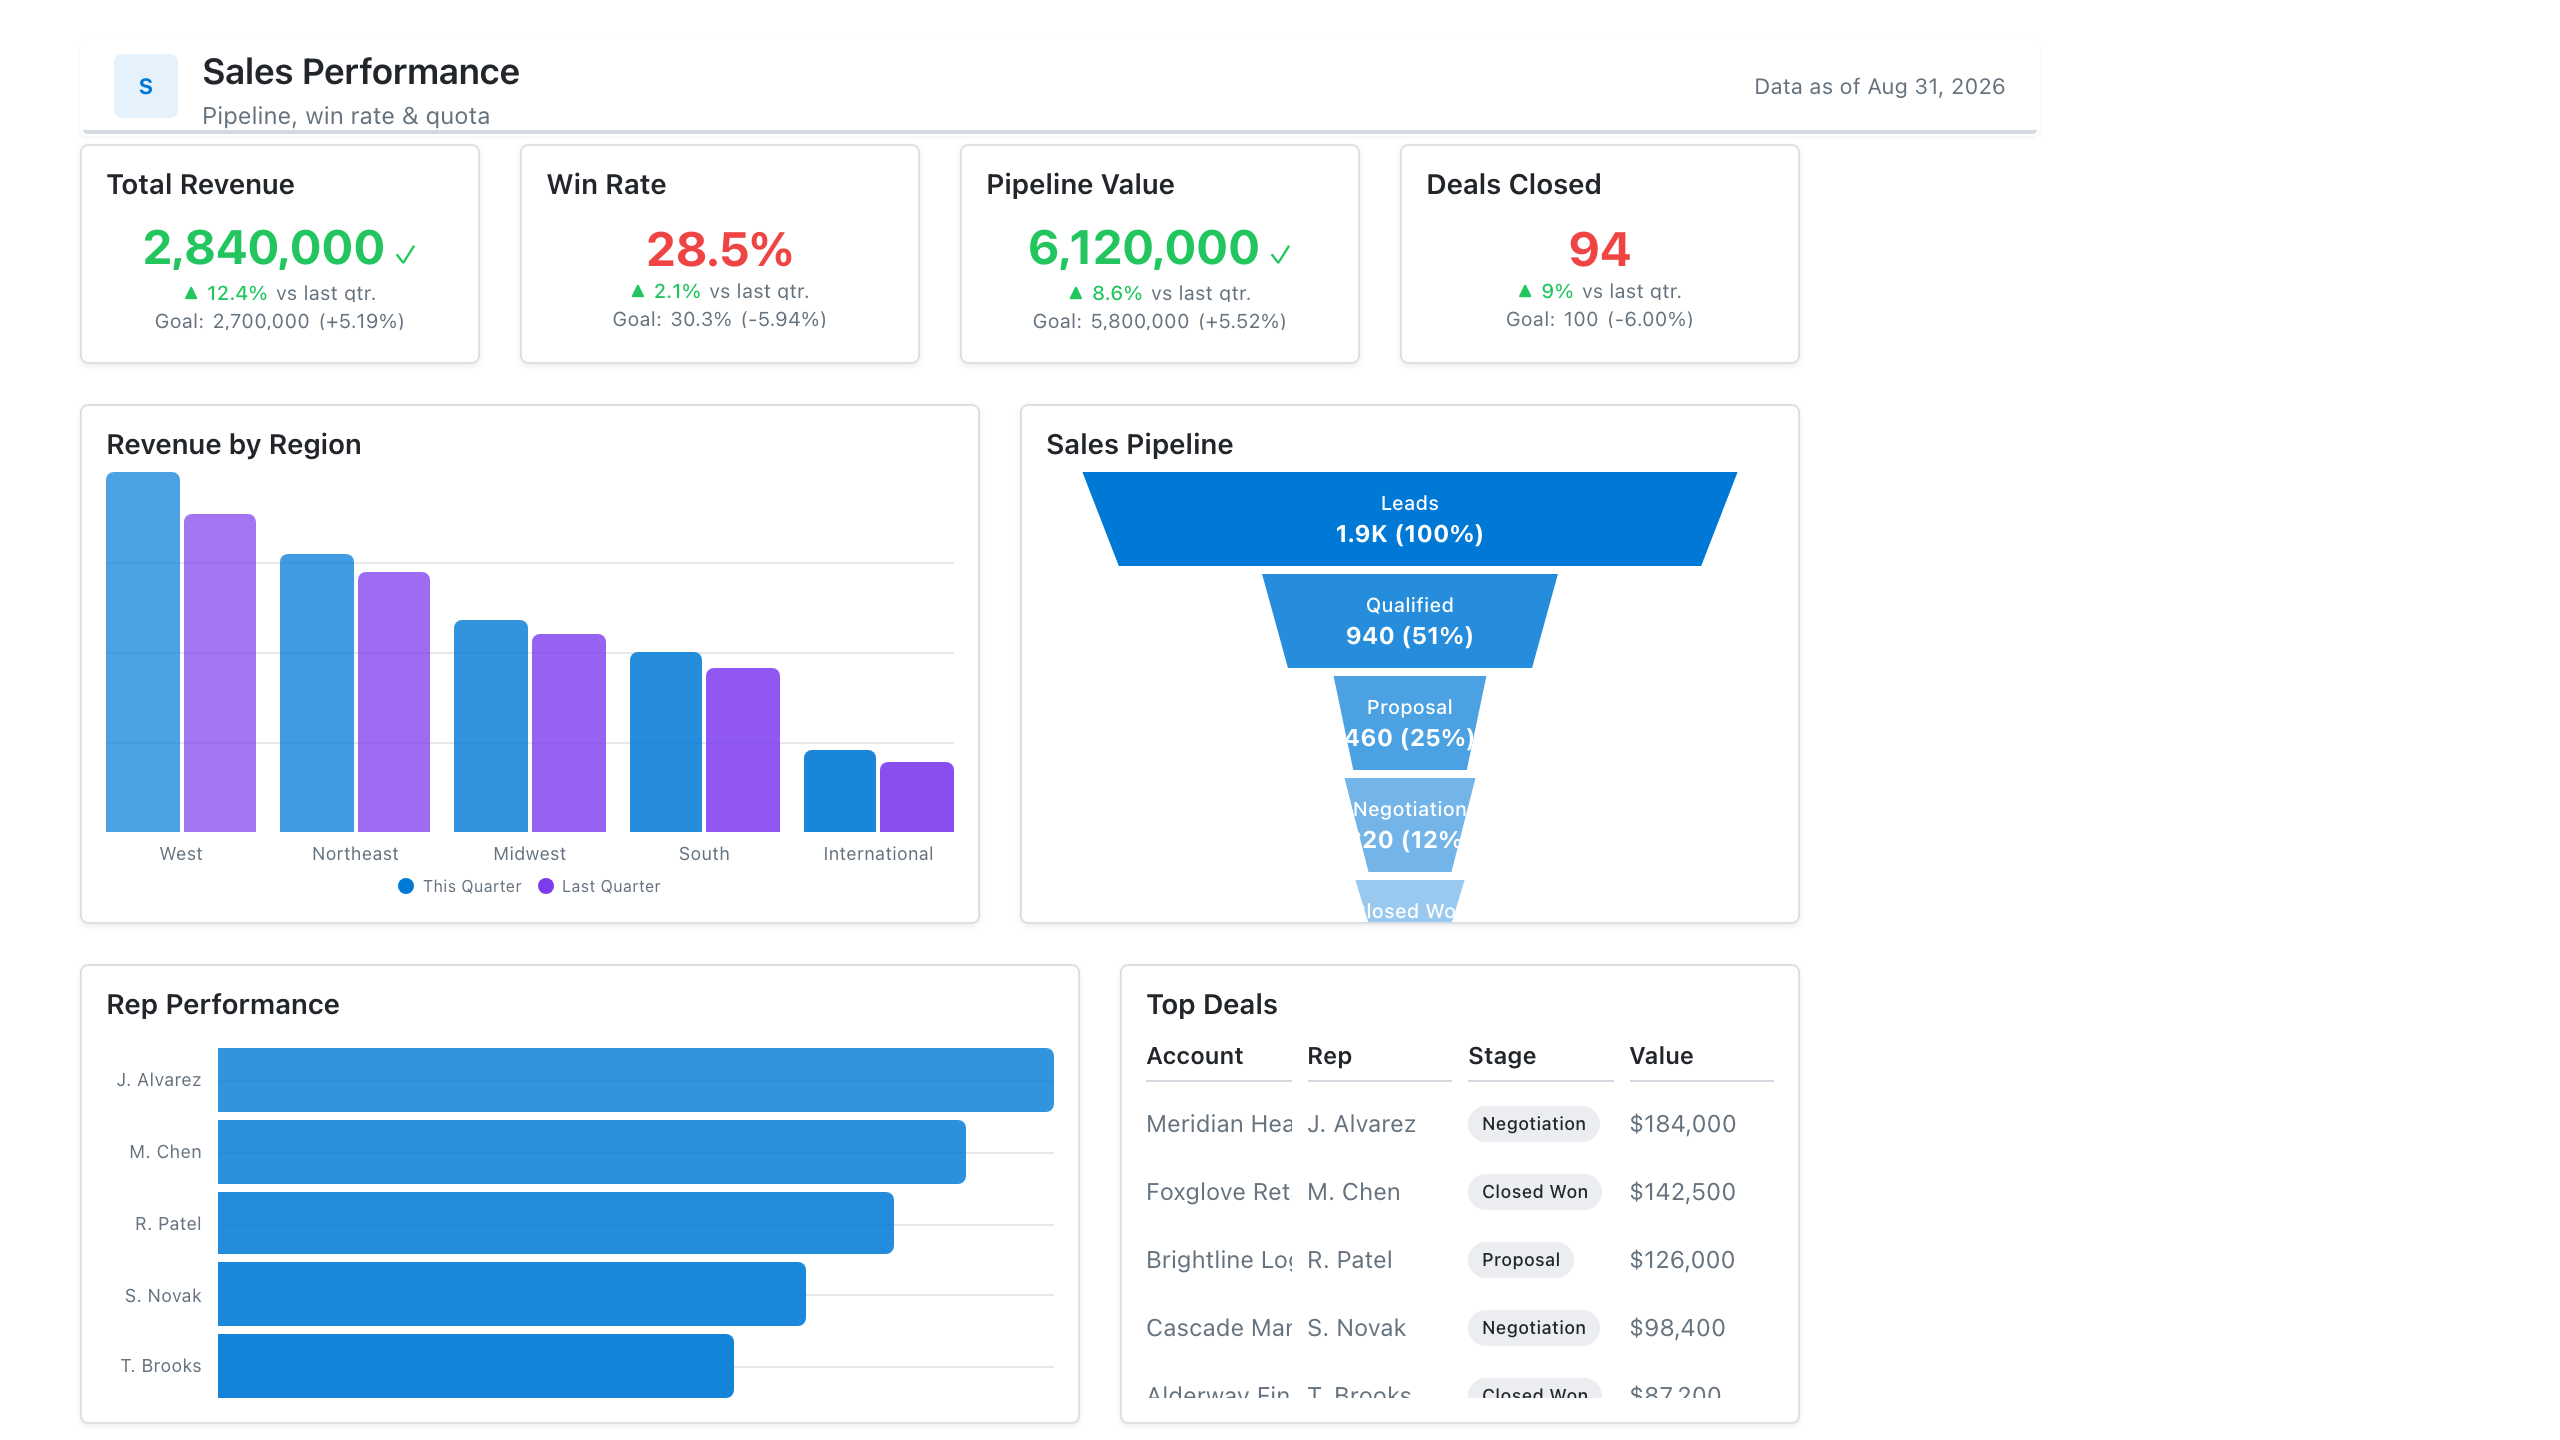
Click the mockup to open it full size
About this template
SalesA single-page view of how the sales org is tracking against target: headline revenue and win-rate KPIs up top, a trend line for bookings, and a rep- or region-level breakdown below. It's the layout most teams reach for when they need one screen for the weekly pipeline review.
Metrics this dashboard tracks
- Revenue vs. target
- Win rate
- Pipeline value & coverage
- Average deal size
- Bookings trend
- Performance by rep / region
What's on the Sales Performance dashboard?
| Section | What it shows | Why it's here |
|---|---|---|
| Header and filters Title card, three dropdown filters | The report title ("Weekly Pipeline Review"), the subtitle "Bookings, win rate and coverage vs quota", a data last updated timestamp, and filters for reporting period (last 12 weeks), region and sales segment. | Lets one page serve every region and segment, so the reader confirms the period and data freshness before trusting any number. |
| KPI row Five KPI cards with a progress bar, a sparkline, mini columns and comparison bars | Bookings vs quota (92.4%, with a bar at 92% of target), win rate (24.8%, with a sparkline), pipeline coverage (3.4x against a 3.0x target), average deal size ($48.5K, with mini columns) and sales cycle (62 days against 68 last quarter, shown as two bars). | Answers whether the team is on track before any chart is read, and each card carries its own comparison, so the reader sees which of the five is off plan. |
| Rep and region row Table with shaded cells, horizontal bar chart | A rep leaderboard with bookings, quota attainment (shaded), win rate and pipeline for four reps plus a total, beside a bar chart of bookings by region (West, East, Central, South, International). | Shows who and where the headline number comes from, so a manager can see which rep to coach and which region is carrying or lagging the total. |
| Funnel and monthly trend row Funnel chart, combo chart (columns and a line) | A pipeline funnel from leads to closed won with counts, share of leads and step-to-step conversion, beside monthly bookings as columns against a quota line from January to December. | Pairs where deals are lost along the funnel with whether monthly results are keeping up with quota, so the reader links a shortfall to a stage and a month. |
What each metric means
Bookings vs quota
- Definition: Bookings in the period as a percentage of the quota for the same period. What counts as a booking (signed contract, annual contract value, first-year value) is defined by each company, so state which one you use.
- Formula:
Bookings vs quota = bookings / quota x 100 - Why it matters: It is the main measure of whether the team is delivering its number.
- Why a KPI card with progress bar: The bar against 100% shows how far short or over target the team sits, which the percentage alone does not.
Win rate
- Definition: The share of closed opportunities that were won in the period. Some companies count by number of deals and others by value, so label which one the card uses.
- Formula:
Win rate = won deals / (won deals + lost deals) - Why it matters: It shows how much pipeline is needed to hit quota and whether deal quality is changing.
- Why a KPI card with sparkline: The sparkline under the number shows the direction of a rate that moves slowly, without needing a separate chart.
Pipeline coverage
- Definition: How many times the open pipeline covers the quota still to be closed. Teams set their own target ratio, and about 3x is a common rule of thumb, but the right ratio depends on win rate.
- Formula:
Pipeline coverage = open pipeline / remaining quota - Why it matters: It shows early whether there is enough pipeline to reach quota, while there is still time to add more.
- Why a KPI card with progress bar: The bar against the 3.0x target shows how much headroom coverage has, which the number alone does not.
Average deal size
- Definition: The average value of won deals in the period. Companies differ on whether they use contract value, annual value or first-year value.
- Formula:
Average deal size = total value of won deals / number of won deals - Why it matters: It explains whether bookings are changing because of more deals or bigger deals.
- Why a KPI card with mini column chart: Small columns for each period show the recent pattern next to the current figure, with the latest period highlighted.
Sales cycle
- Definition: The average number of days from deal creation to close for won deals. Some teams start the clock at first meeting or qualification instead of creation.
- Formula:
Sales cycle = average of (close date - created date) for won deals - Why it matters: It shows whether deals started now can still close inside the quarter.
- Why a KPI card with comparison bars: Two bars for the previous and current period make the change in days visible at a glance.
Rep leaderboard and quota attainment
- Definition: Each rep's bookings, quota attainment, win rate and open pipeline in the period. Quota attainment is a rep's bookings as a percentage of that rep's own quota.
- Formula:
Quota attainment = rep bookings / rep quota x 100 - Why it matters: It shows how performance is spread across the team, which one total cannot.
- Why a table: A table keeps exact values for several measures per rep in one row, and shading on the attainment column draws the eye to the strongest and weakest results.
Bookings by region
- Definition: Bookings in the period split by sales region, in the same currency and period as the headline cards.
- Formula:
Region bookings = sum of bookings where region = the region - Why it matters: It shows which regions carry the total and which are small or behind.
- Why a bar chart: Horizontal bars sorted by value make five labelled categories easy to rank and read, with the amount at the end of each bar.
Pipeline funnel by stage
- Definition: The number of leads or opportunities that reach each stage from leads to closed won, with the percentage that moves from one stage to the next. Stage names are specific to each company.
- Formula:
Stage conversion = records reaching the next stage / records that entered the stage - Why it matters: It shows where deals are lost, so the team can see which stage needs the most attention.
- Why a funnel chart: Narrowing bars show the drop between stages, and the percentages beside them mark the weakest step.
Monthly bookings vs quota
- Definition: Bookings for each month shown against that month's quota, so the reader can see which months met the number.
- Formula:
Monthly gap = monthly bookings - monthly quota - Why it matters: It shows whether a shortfall is one bad month or a steady trend.
- Why a combo chart: Columns show the amount booked each month and a line shows the quota on the same scale, so the gap is visible month by month.
Data you need to build this
- CRM (Salesforce, HubSpot or similar), opportunity or deal object Deal ID, Owner (rep), Amount, Stage, Status (open, won, lost), Created date, Close date, Region, Segment
- CRM stage history or field history Deal ID, Stage, Entered date, Exited date
- Lead or opportunity records for the funnel Record ID, Stage reached, Date reached, Owner, Region
- Quota or planning sheet Rep, Region, Month, Quota, Target coverage ratio
Why it's laid out this way
- The five KPI cards come first, directly under the filters, so the question of whether the team is on plan is answered before any chart is read. Each card carries its own comparison: a bar to quota or target, a sparkline, mini columns or previous-period bars.
- The middle row splits the total by people and place: the leaderboard table ranks reps with shaded attainment, and the bar chart ranks regions. Both use the same bookings period as the cards, so a manager can go from a weak total to the rep or region behind it.
- The bottom row explains why. The funnel shows where deals drop out, and the combo chart shows monthly bookings against the quota line, so the reader ties a shortfall to a stage and to a month.
Last updated:
More like this
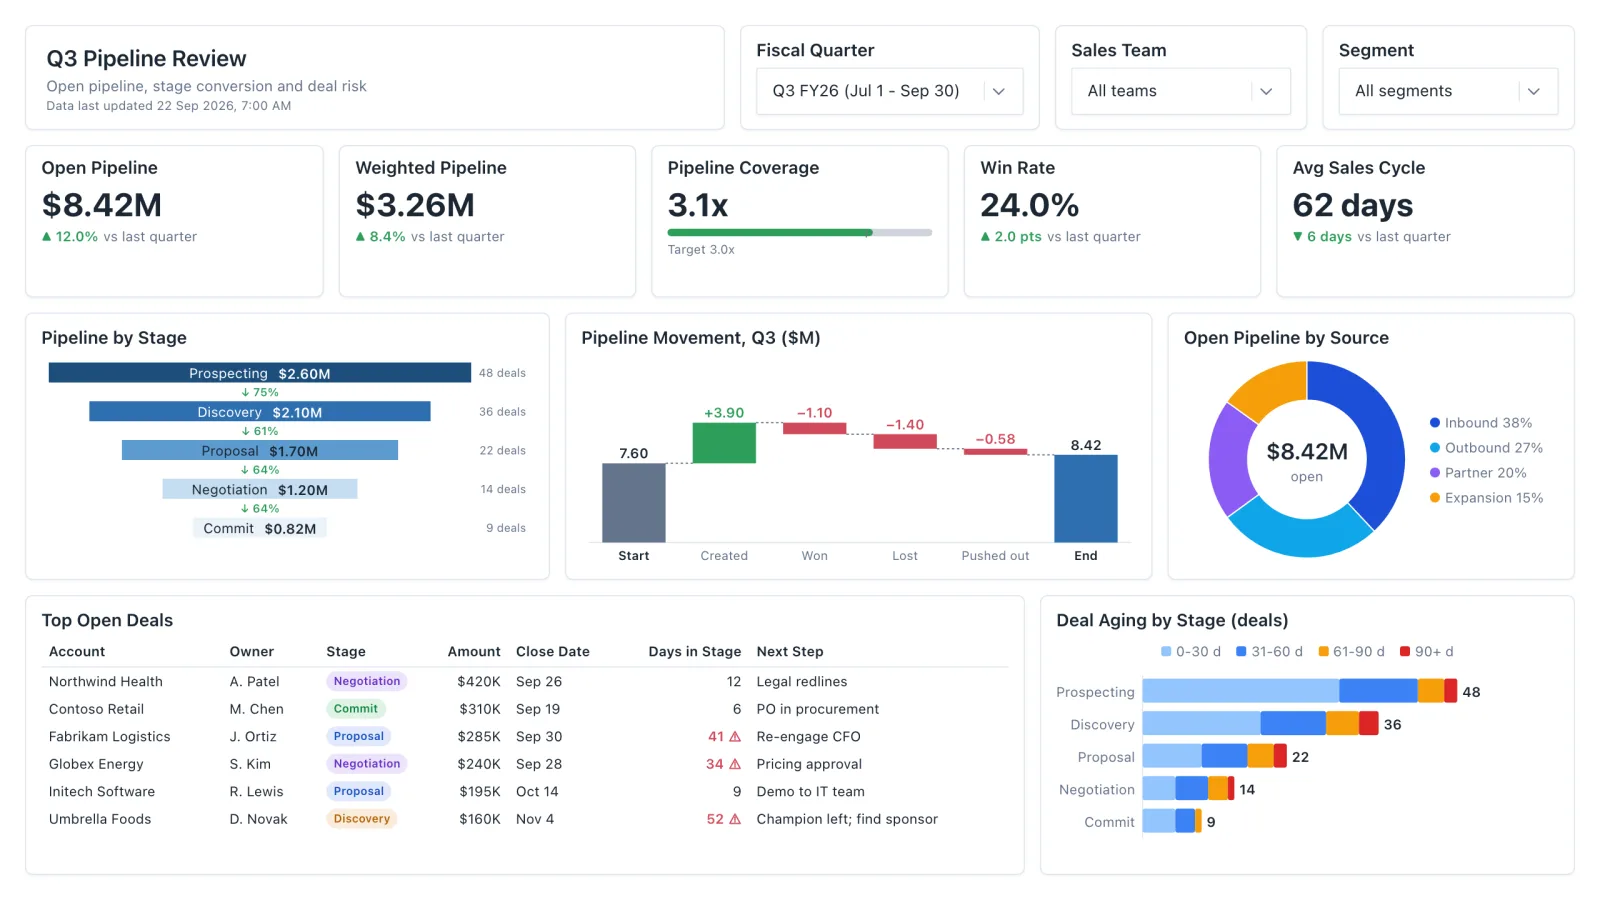
Sales Pipeline
Sales pipeline dashboard with open and weighted pipeline, coverage vs target, a stage funnel and stale-deal flags.
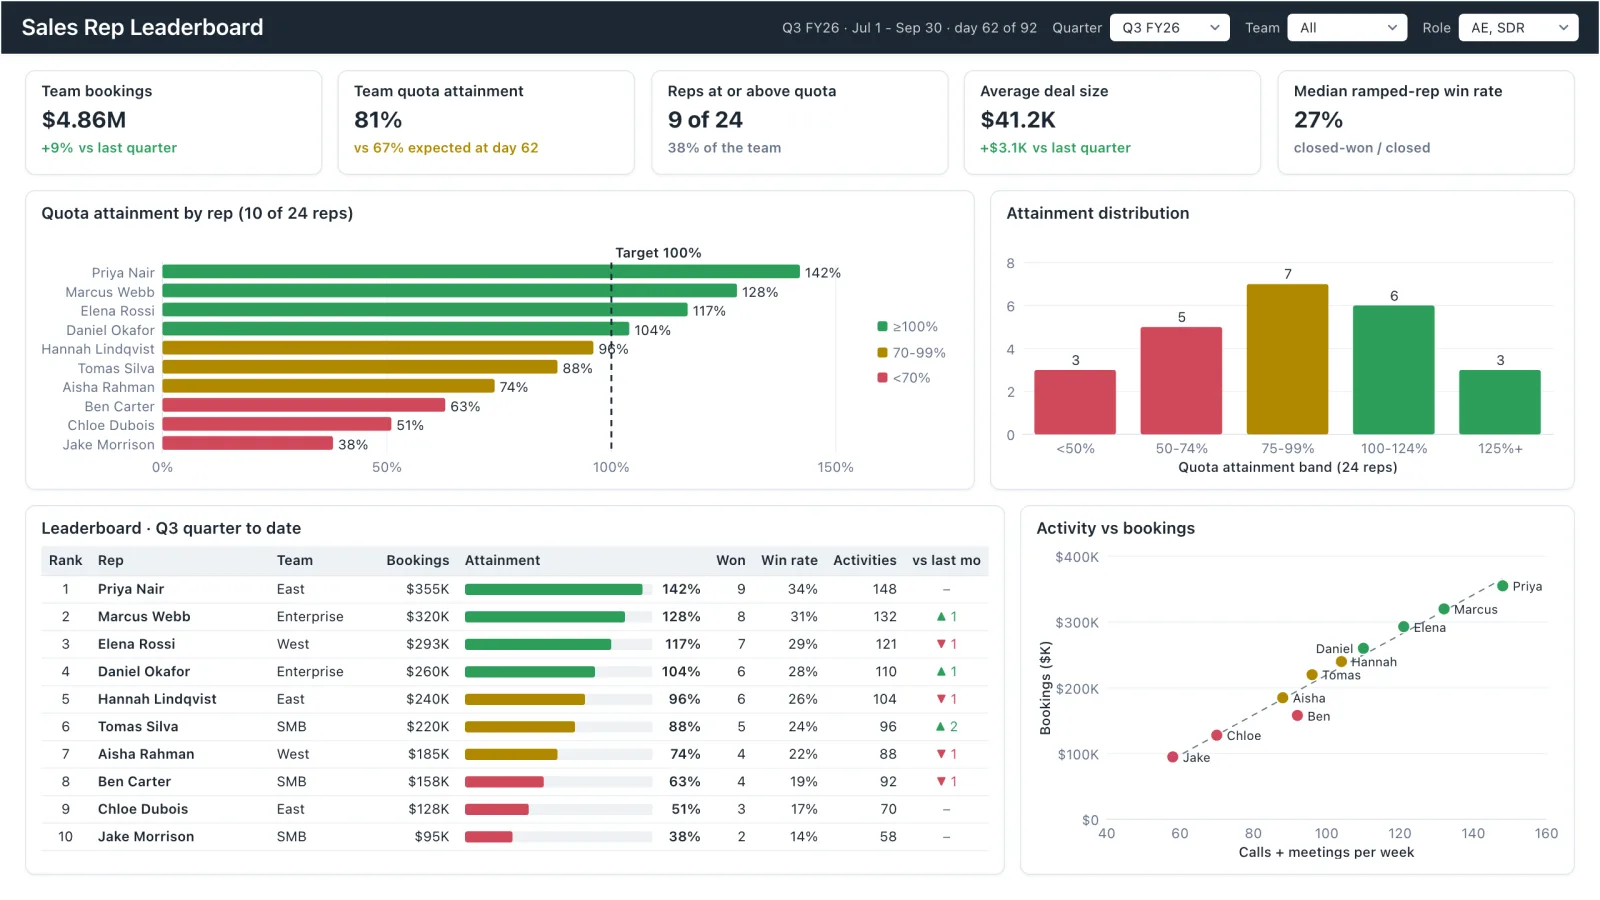
Sales Rep Leaderboard
Sales rep dashboard example with quota attainment by rep, a ranked leaderboard table and activity vs bookings.
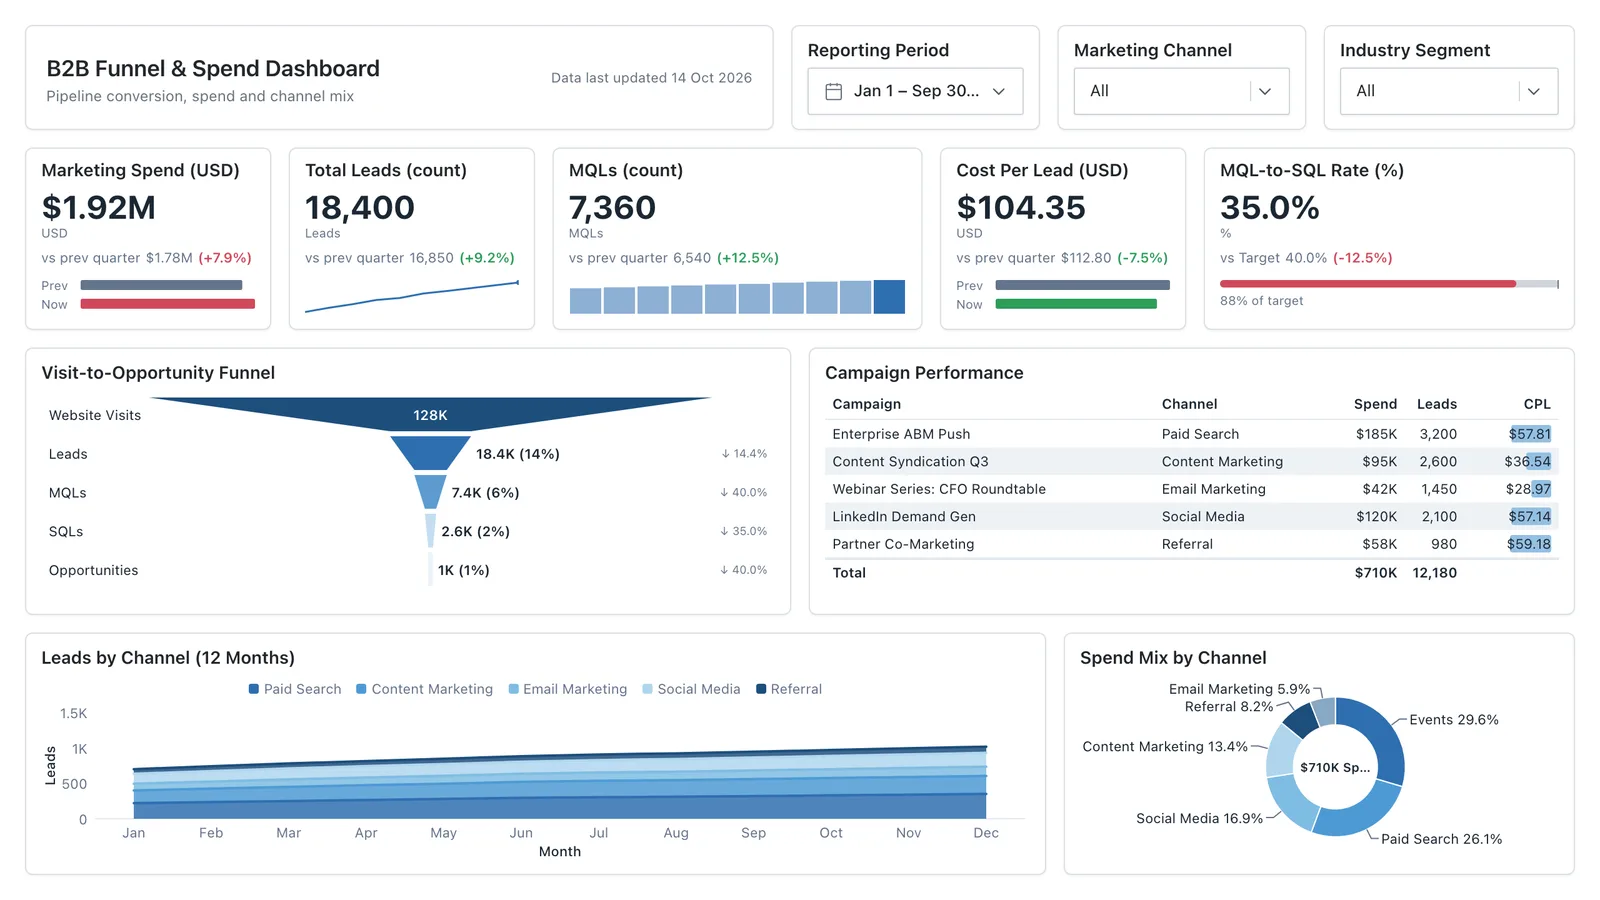
Marketing Analytics
Campaign spend, traffic sources, conversion funnel, and lead volume in one wireframe.
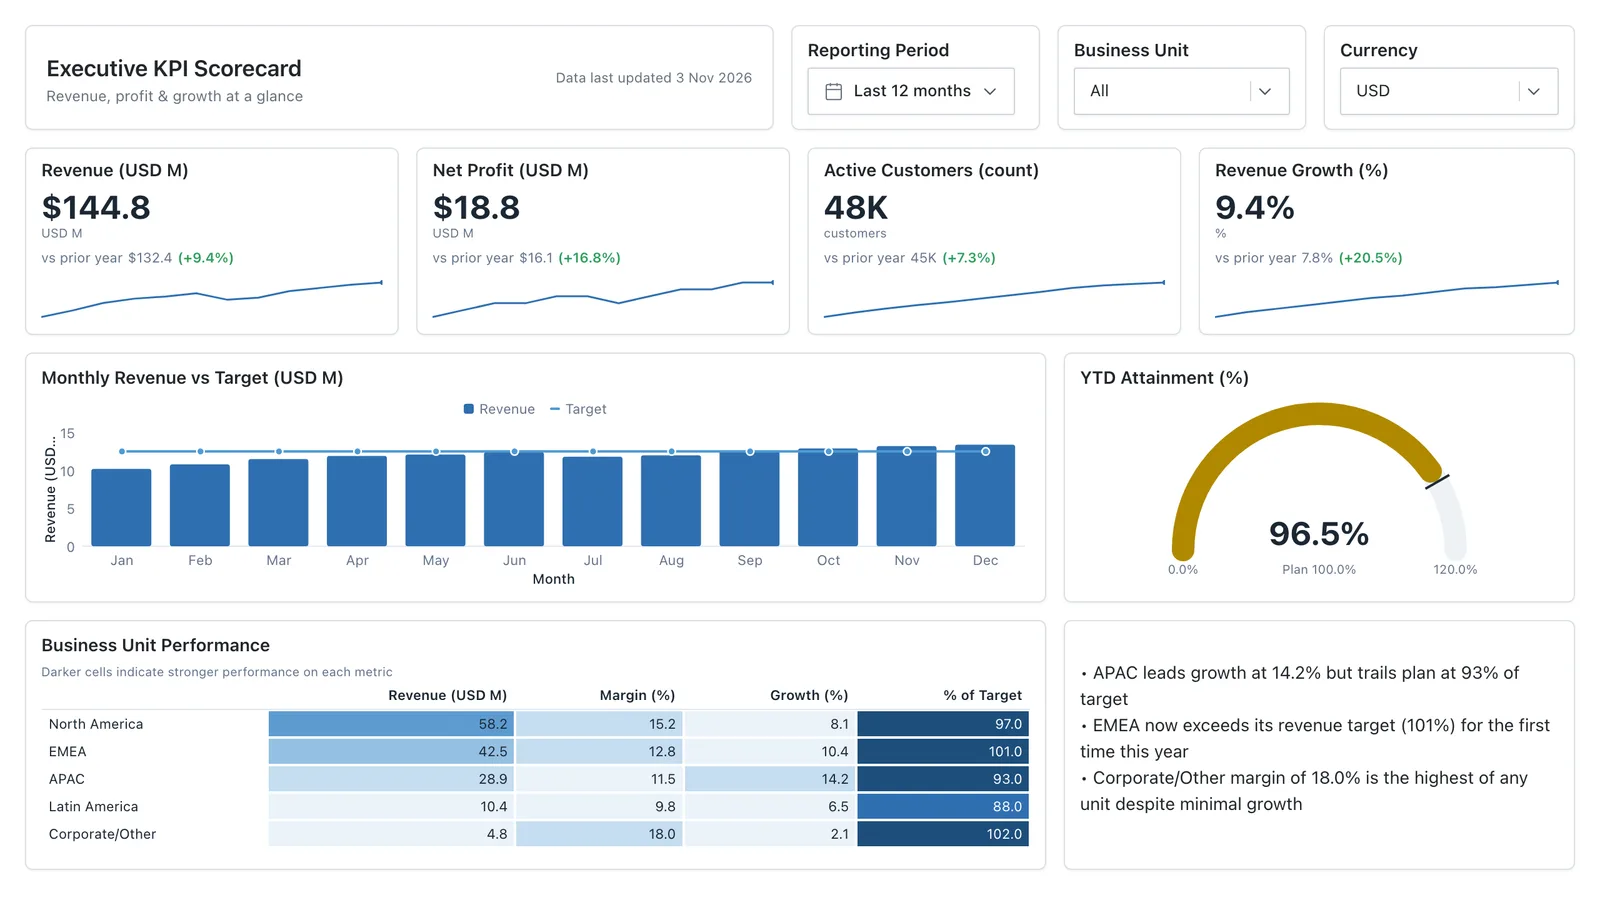
Executive KPI Overview
Single-page executive view of the metrics leadership cares about — built for the first client meeting.
Sales, finance, HR, SaaS, and more — filter by team or search by metric.