Visuals

Heatmap

Also called: Heat map, Highlight table, Colour-scale matrix

A heatmap is a grid where each cell is shaded by its value, darker for higher, so patterns across two dimensions, like day of week by hour, stand out before you read a number.
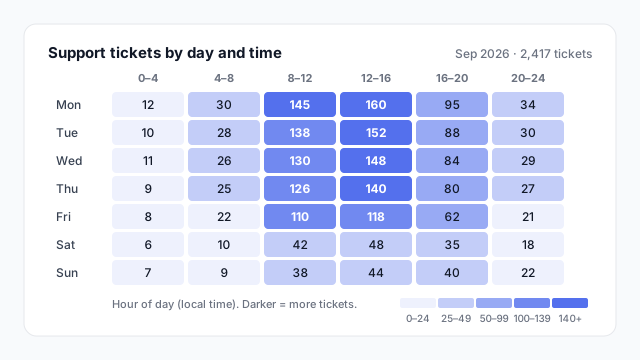
Heatmap of 2,417 support tickets by day of week and four-hour block, shaded light to dark blue. Weekday 8:00–16:00 is darkest, peaking at 160 tickets on Monday 12–16; nights and weekends are lightest.

How a heatmap works

A heatmap takes a matrix of one measure across two dimensions and replaces (or backs) each number with a colour. The eye picks out dark blocks long before it reads a single value.

In the example above, the dark band across weekdays from 8:00 to 16:00 tells a support lead where to put staff, and the pale weekend rows tell them where not to. The same 42 numbers as a plain table would take a minute to read.
Types of heatmap

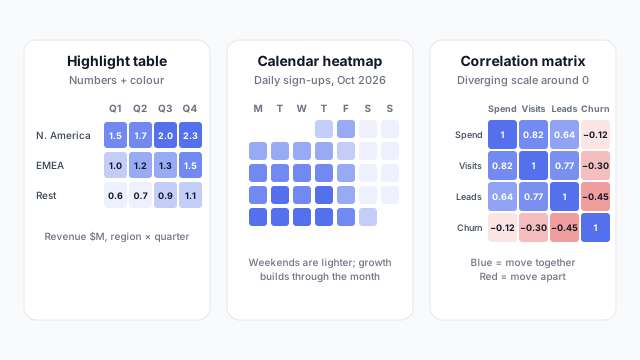
A highlight table of revenue by region and quarter, a calendar heatmap of daily sign-ups for October 2026, and a correlation matrix with positive values in blue and negative in red

Ordered from most to least common on dashboards:
  1. Highlight table. A matrix with numbers and shading. The default in business reporting because people still want the figures.
  2. Time grid. Day by hour or week by weekday, as in the illustration. Great for staffing, traffic and load.
  3. Calendar heatmap. One cell per day in a calendar layout. Shows weekly rhythm and streaks at a glance.
  4. Correlation matrix. Every measure against every other, shaded by how strongly they move together. More common in analysis than on dashboards.

Pick the right colour scale

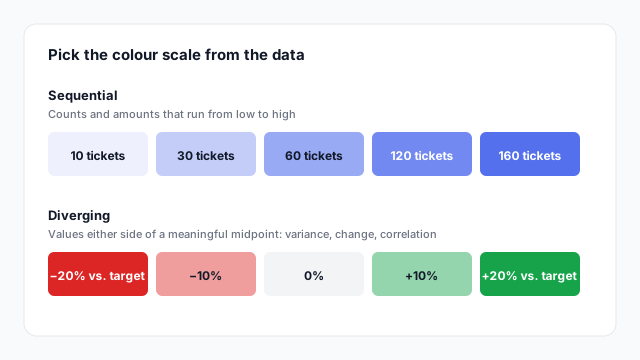
Sequential scale from light to dark blue for 10 to 160 tickets, and a diverging scale from red at −20% through grey at 0% to green at +20% vs target

  • Sequential (one hue, light to dark) for anything that runs from low to high: counts, revenue, hours.
  • Diverging (two hues around a neutral midpoint) for values with a meaningful zero: variance to target, growth, correlation.

Colour follows meaning: if higher is bad, as with complaints or costs, make sure the scale or the caption says so.

In Power BI vs. Tableau

Power BITableau
Built-inMatrix + conditional formatting (background colour scale)Heat map and Highlight table in Show Me
Colour scaleGradient or rules in the conditional formatting dialogEdit Colours on the Colour legend

Best practices

  • Say what darker means. A caption like “Darker = more tickets” turns decoration into information.
  • Use bins or a legend so readers can tell 120 from 160.
  • Keep it small enough to label, roughly 8 rows by 6 columns. Beyond that, drop the numbers and rely on colour.
  • Order rows and columns naturally (Mon → Sun, morning → night), or sort by total so the pattern is easy to see.

Mocking up a heatmap

In Mockko, a heatmap is the matrix visual with a colour scale turned on, plus a caption saying what darker means. Agree the two dimensions and the scale on a mockup before anyone writes the conditional formatting.

See it in a real layout

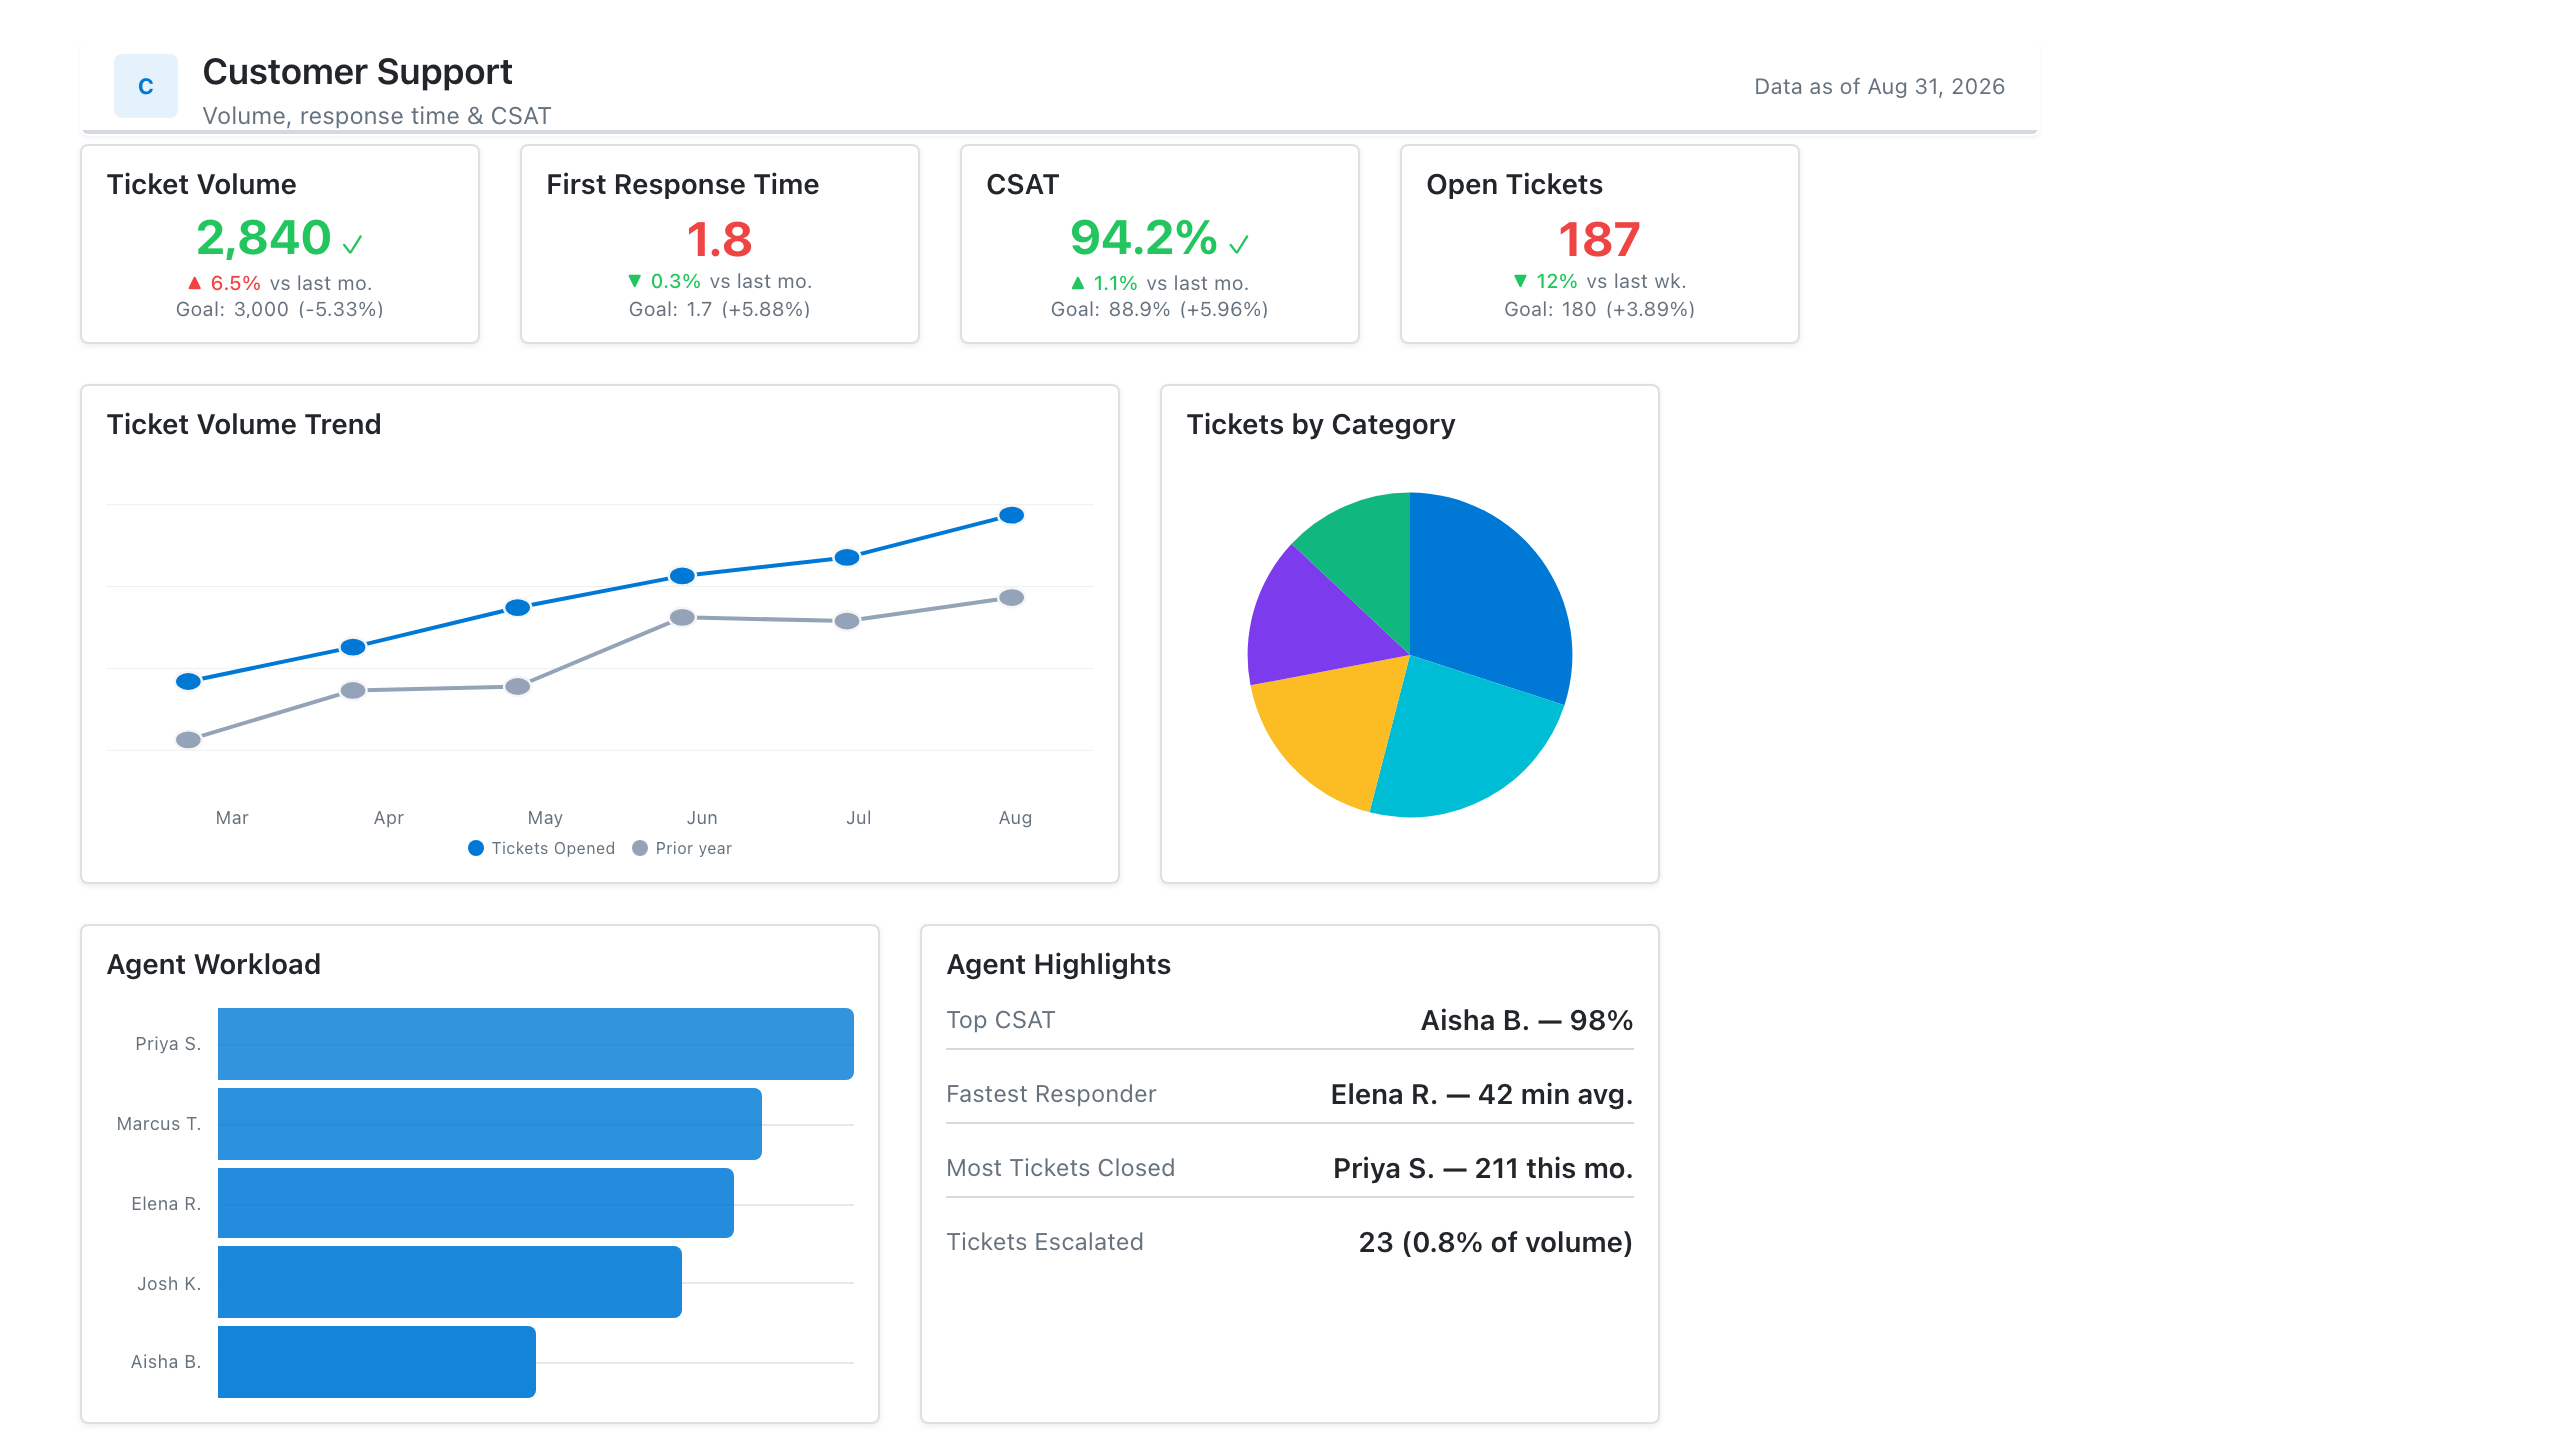
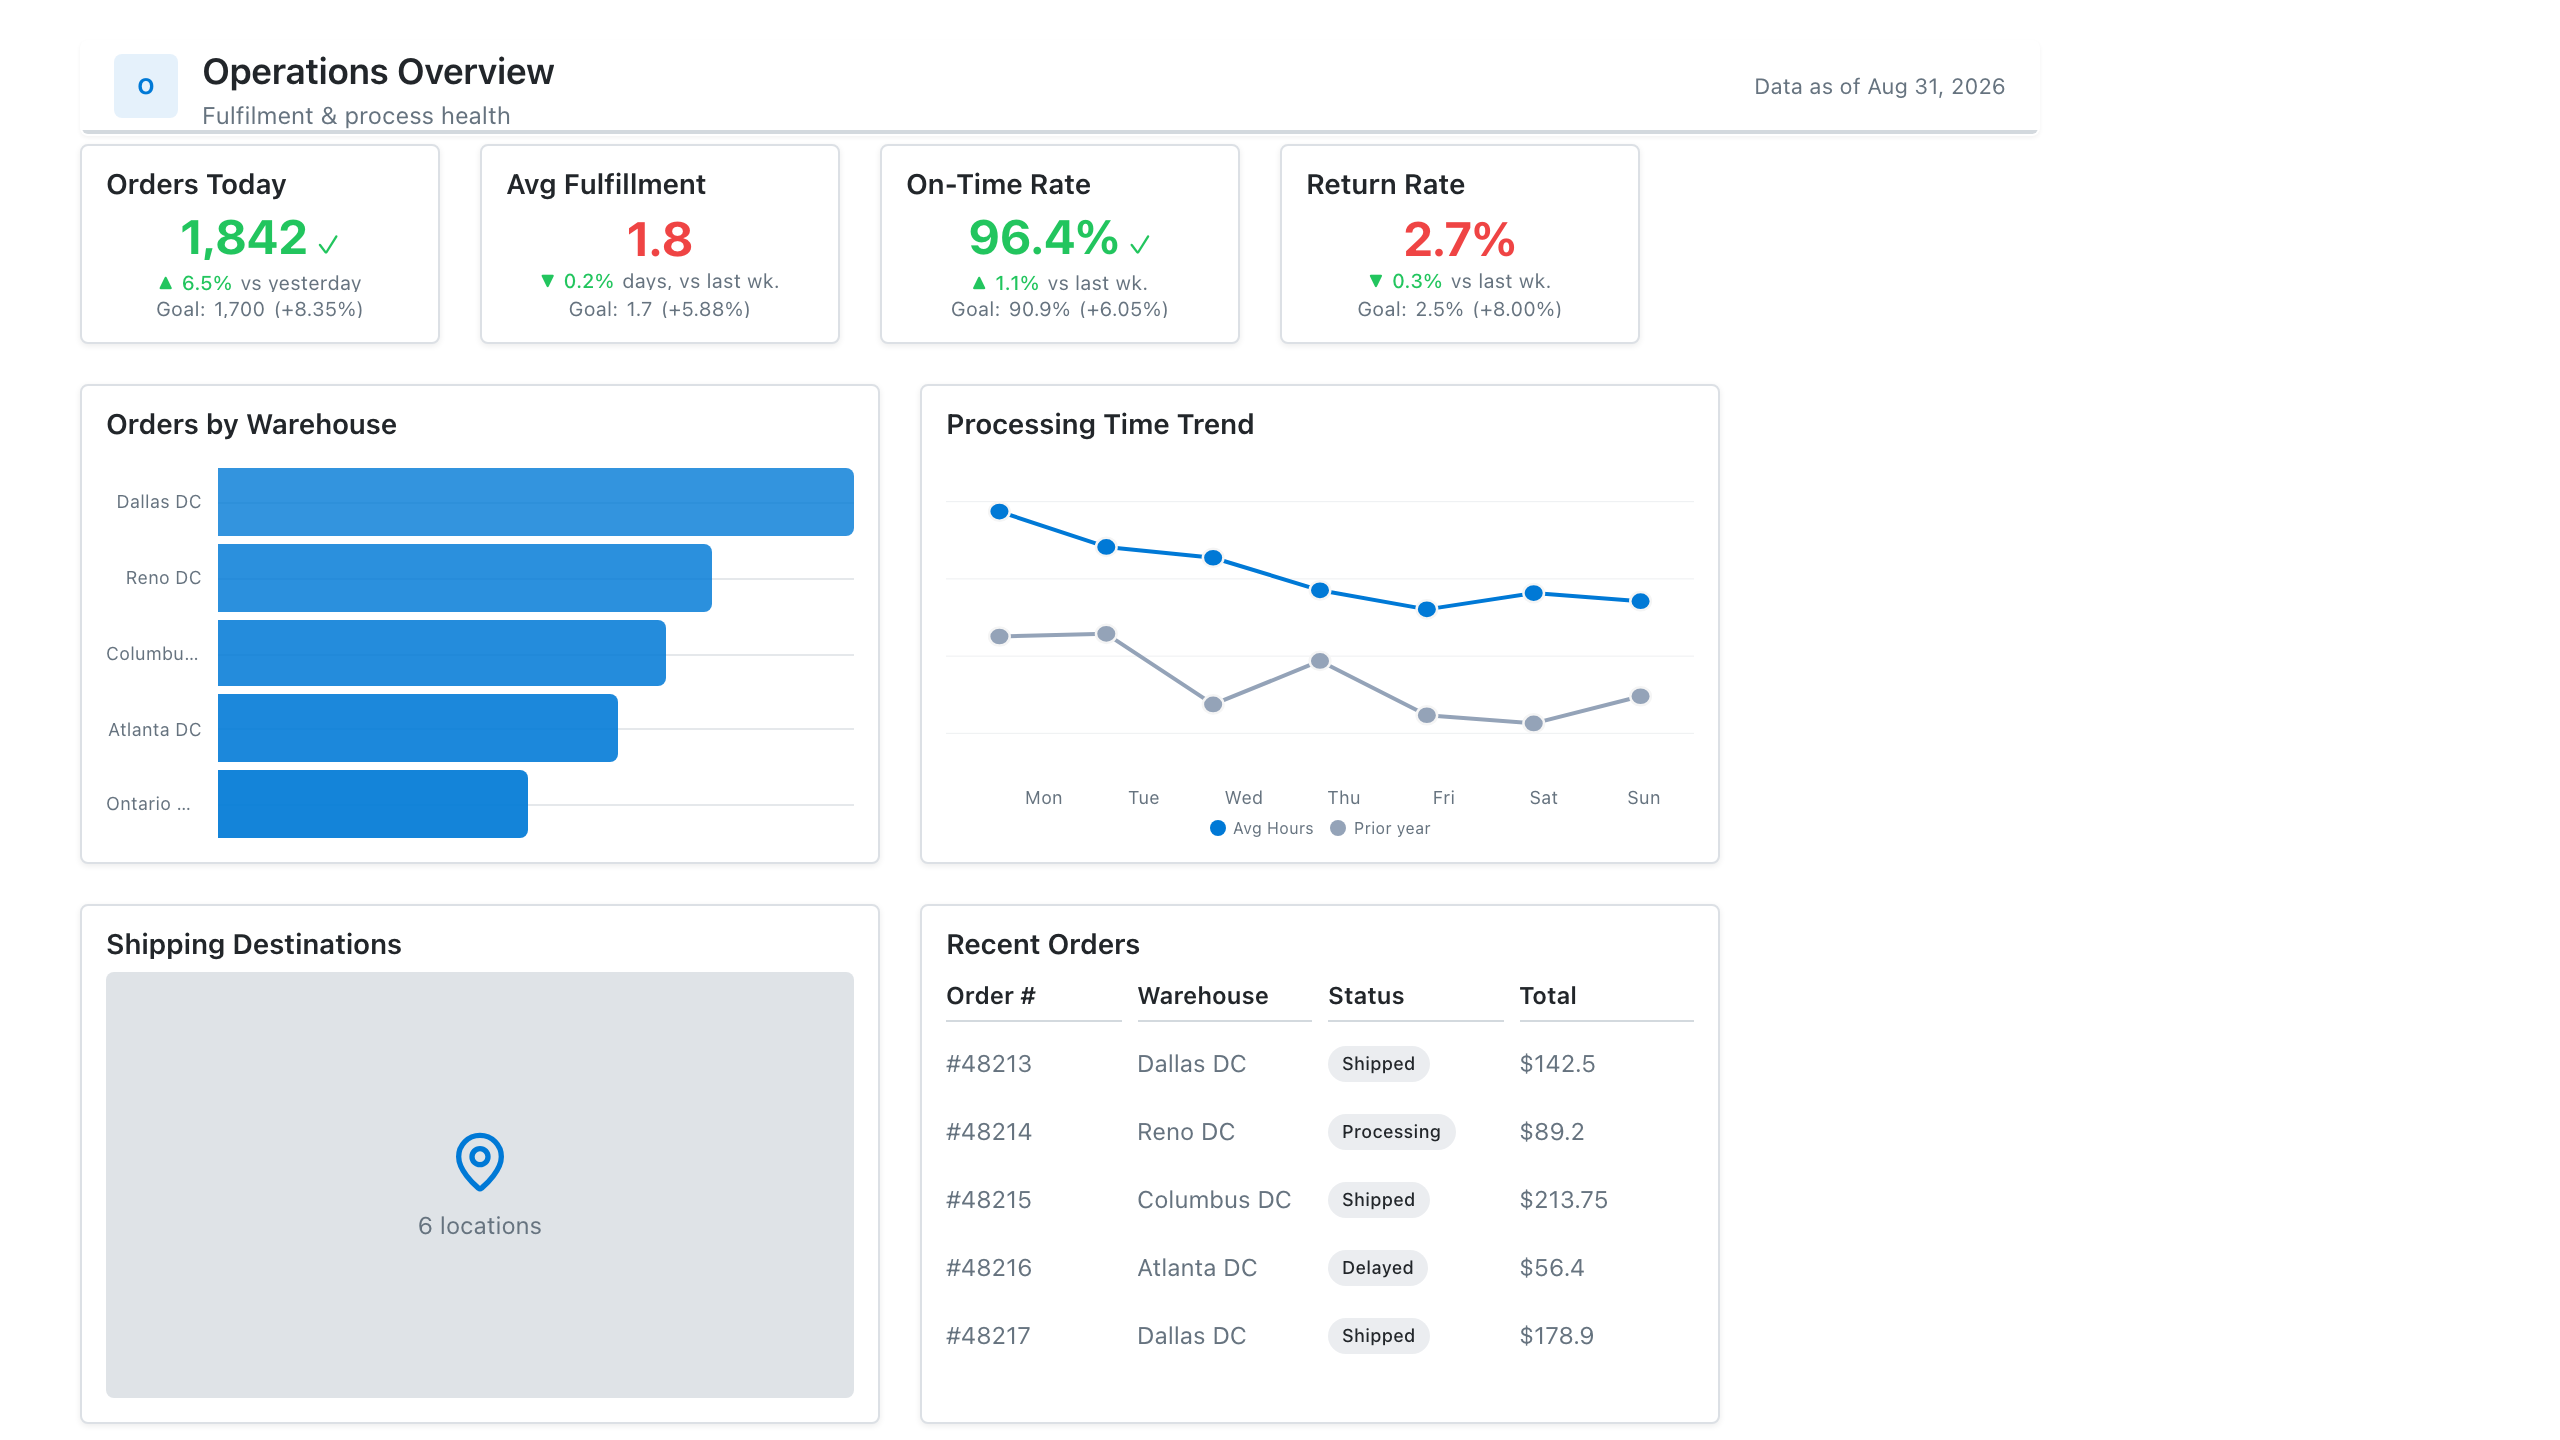
These free Mockko templates use it. Open one and edit it in your browser.

Related terms

Common questions

Does Power BI have a heatmap visual?
Not as a separate built-in visual. The usual way is a matrix with conditional formatting on the cell background, using a colour scale. Custom heatmap visuals are also available in AppSource.
What's the difference between a heatmap and a highlight table?
A highlight table is a heatmap that keeps the numbers in the cells. A pure heatmap shows only colour, which works when there are too many cells to label. Tableau offers both in Show Me.
What colours should a heatmap use?
One hue from light to dark for values that run low to high, such as counts. Two hues either side of a neutral midpoint for values that can be good or bad, such as variance to target or correlation.

Mock it up before you build it

Lay out your Power BI or Tableau dashboard in Mockko, get sign-off, then build. Free to start.

Try Mockko free