Operations Overview Dashboard Mockup Template
The Operations Overview dashboard template is a one-page layout for operations managers and site leads running distribution or fulfilment, built to decide which sites and orders need attention to hit delivery targets. It shows units shipped, on-time fulfillment, average cycle time, defect rate and throughput against capacity.
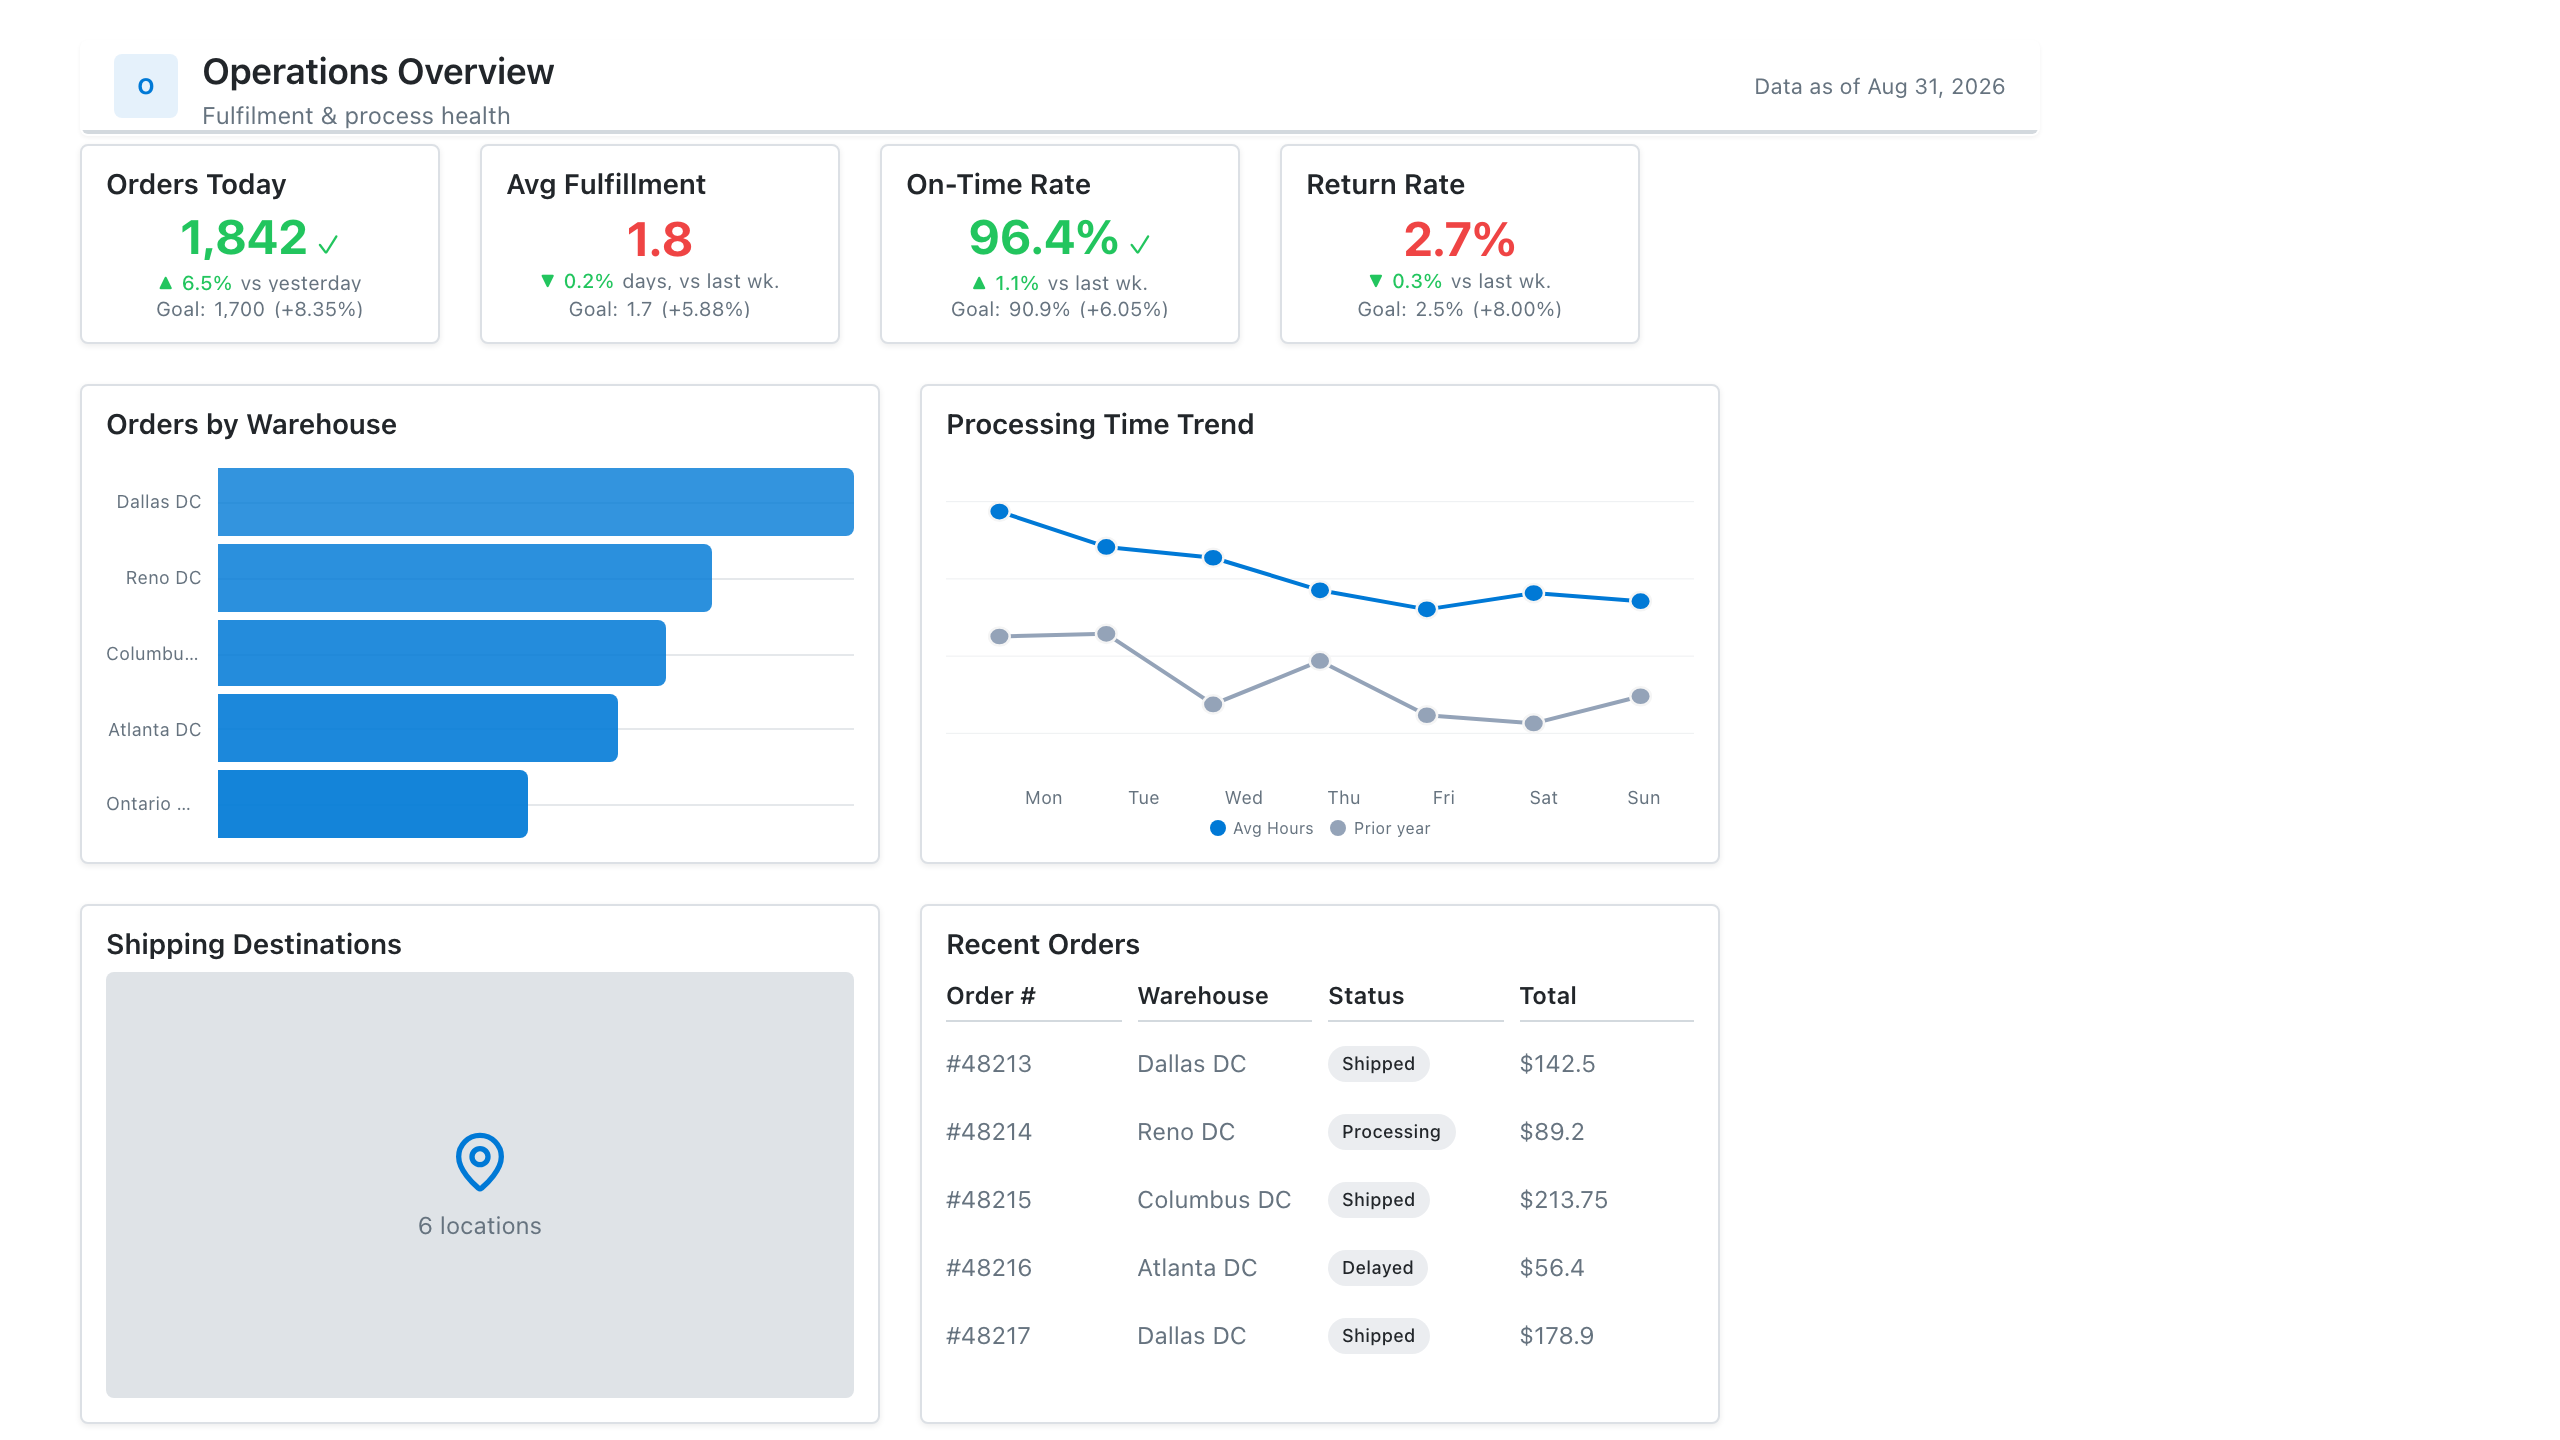
Click the mockup to open it full size
About this template
OperationsA general operations layout for teams that run on throughput and SLAs: volume and cycle-time KPIs, a backlog trend, an SLA-attainment gauge, and a breakdown by process or site. Adapts to manufacturing, logistics, claims, or back-office ops.
Metrics this dashboard tracks
- Throughput / volume processed
- Process cycle time
- SLA attainment
- Backlog / WIP
- Error or rework rate
- Performance by site / process
What's on the Operations Overview dashboard?
| Section | What it shows | Why it's here |
|---|---|---|
| Header and filters Title card, date dropdown, two dropdown filters | The report title ("DC Ops Command Center"), a subtitle, a data last updated timestamp, and filters for shift date (last 14 days), site and shift. | Lets the same page serve every site and shift, so the reader confirms the scope and data freshness before reading any figure. |
| KPI row Four KPI cards with a sparkline, a progress bar and two comparison bars | Units shipped (184.3K, with a sparkline), on-time fulfillment (96.2% against a 97.0% target, with a progress bar), average cycle time (4.8 hours) and defect rate (1.3%), the last two with previous versus current bars. | Reports volume, service level, speed and quality in four numbers, and the target and previous-period bars show at once which measure is off track. |
| Site and weekday row Heatmap table, ranked list with change arrows | Throughput in units for each site by weekday with darker cells for higher volume and a total column, beside on-time fulfillment for each site with a green or red change arrow. | The heatmap shows where and when volume peaks so labour can be planned, and the site list shows which site is behind on delivery and whether it is improving. |
| Capacity and exceptions row Column chart with a capacity line, table with bars | Daily throughput over 14 days as columns against a capacity line, beside a table of open exceptions (order, site, issue, age in hours) with age drawn as a bar in the cell. | Throughput close to the capacity line warns of a bottleneck, and the exception list turns the report into a work queue, with the oldest items easiest to see. |
What each metric means
Units shipped
- Definition: The total number of units dispatched from the sites in the period. Some operations count units shipped, others orders or lines, so label the unit you use.
- Formula:
Units shipped = sum of units dispatched in the period - Why it matters: It is the main throughput measure and the base for capacity planning.
- Why a KPI card with sparkline: A large total with a small trend line shows the volume and its direction over the period in one card.
On-time fulfillment
- Definition: The share of orders shipped or delivered by the promised date. Whether the clock stops at shipment or delivery, and what counts as the promise date, varies by company.
- Formula:
On-time fulfillment = orders fulfilled on or before promised date / total orders fulfilled - Why it matters: It is the service level customers experience, so a gap to target needs a cause.
- Why a KPI card with progress bar: The bar against the 97.0% target shows how close the result is to goal, which the number alone does not.
Average cycle time
- Definition: The average elapsed time to process an order, shown in hours. Start and end points, such as order release to dispatch, differ by operation, so define them on the report.
- Formula:
Average cycle time = average of (end time - start time) per order - Why it matters: Shorter cycle time means faster flow, and a rise often precedes missed delivery dates.
- Why a KPI card with comparison bars: Paired previous and current bars show the size of the improvement or decline against the prior period.
Defect rate
- Definition: The share of units or orders with an error such as damage, a wrong item or a missing label. What counts as a defect and whether it is found before or after dispatch varies by company.
- Formula:
Defect rate = defective units / total units processed - Why it matters: Defects cause rework, returns and unhappy customers, so the rate shows the cost of speed.
- Why a KPI card with comparison bars: Previous and current bars show the change in a small percentage that is hard to judge from the digits alone.
Throughput by site and weekday
- Definition: Units processed by each site on each day of the week over the selected period, with a total per site. Darker cells mean higher volume.
- Formula:
Cell value = sum of units processed at the site on that weekday - Why it matters: It shows weekly demand patterns and which sites carry the most volume, which guides shift planning.
- Why a heatmap: Colour intensity lets the reader find peaks and quiet days across sites and weekdays without reading every number.
Site on-time fulfillment
- Definition: On-time fulfillment calculated for each site, with a change indicator against the previous period.
- Formula:
Site on-time fulfillment = on-time orders at the site / orders fulfilled at the site - Why it matters: It shows which site pulls the overall figure down.
- Why a ranked list with change arrows: A short list of four sites with large values and arrows is read faster than a chart and compares sites directly.
Daily throughput versus capacity
- Definition: Units processed each day over 14 days as columns, with the daily capacity of the network drawn as a line. Capacity is the planned maximum units the sites can process.
- Formula:
Utilisation = throughput / capacity - Why it matters: It shows how close operations run to the limit and when volume is likely to cause delays.
- Why a combo chart: Columns show volume per day and the line shows the limit on the same scale, so the gap between them is clear.
Open exceptions
- Definition: Orders with an unresolved problem, listed with site, issue type and age in hours since the issue was raised.
- Formula:
Age = now - time the exception was raised - Why it matters: The oldest items are the most likely to miss a delivery promise, so they are worked first.
- Why a table: A table carries order numbers and text issues that charts cannot, and in-cell bars make age comparable by length.
Data you need to build this
- Warehouse management system (WMS) or order management system Order ID, Site, Shift, Units shipped, Order release time, Ship time, Promised date, Delivered date
- Quality or returns records Order ID, Site, Defect type, Defective units, Date found
- Capacity or labour planning sheet Site, Date, Planned capacity in units, On-time target
- Exception or issue log Order ID, Site, Issue type, Raised time, Status
Why it's laid out this way
- The four KPI cards lead because they answer whether the operation is on target. Each carries its own context, a sparkline for volume, a progress bar for the on-time target and previous versus current bars for time and defects.
- The heatmap and the site list share a row so the volume pattern by site and weekday sits next to the service level of the same four sites, making it easy to ask whether the busiest sites also deliver on time.
- The bottom row moves from the network to the individual order. The throughput columns with a capacity line show headroom over 14 days, and the exceptions table with age bars gives the team a worklist.
Last updated:
More like this
Project Delivery
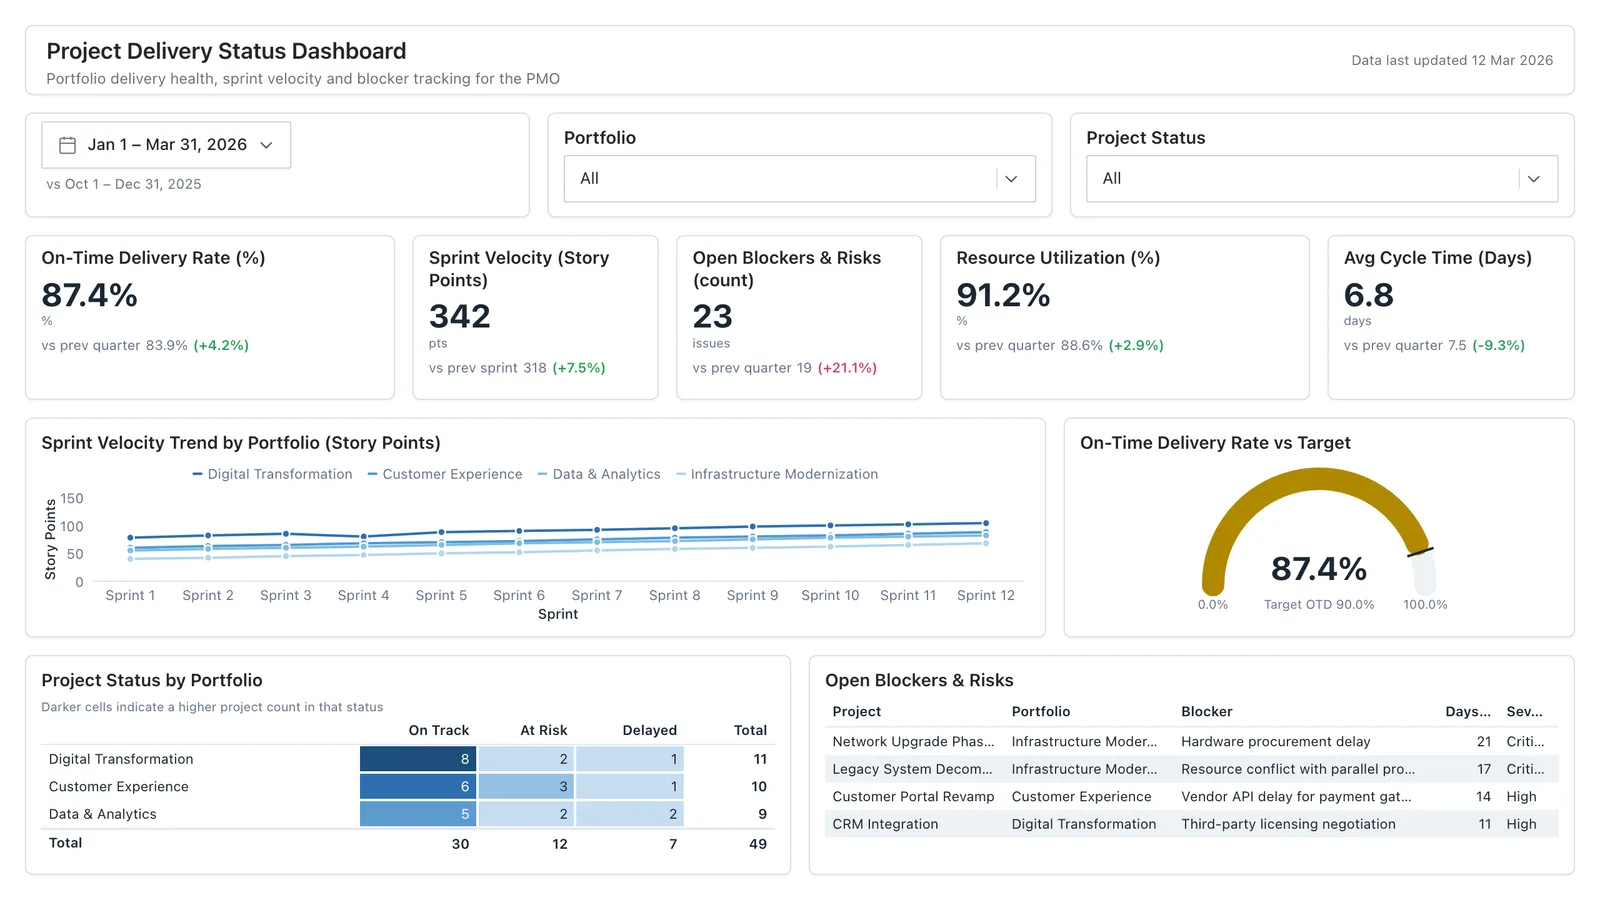
Sprint velocity, on-time delivery rate, blockers, and resource utilisation for internal reporting.
Sales Performance
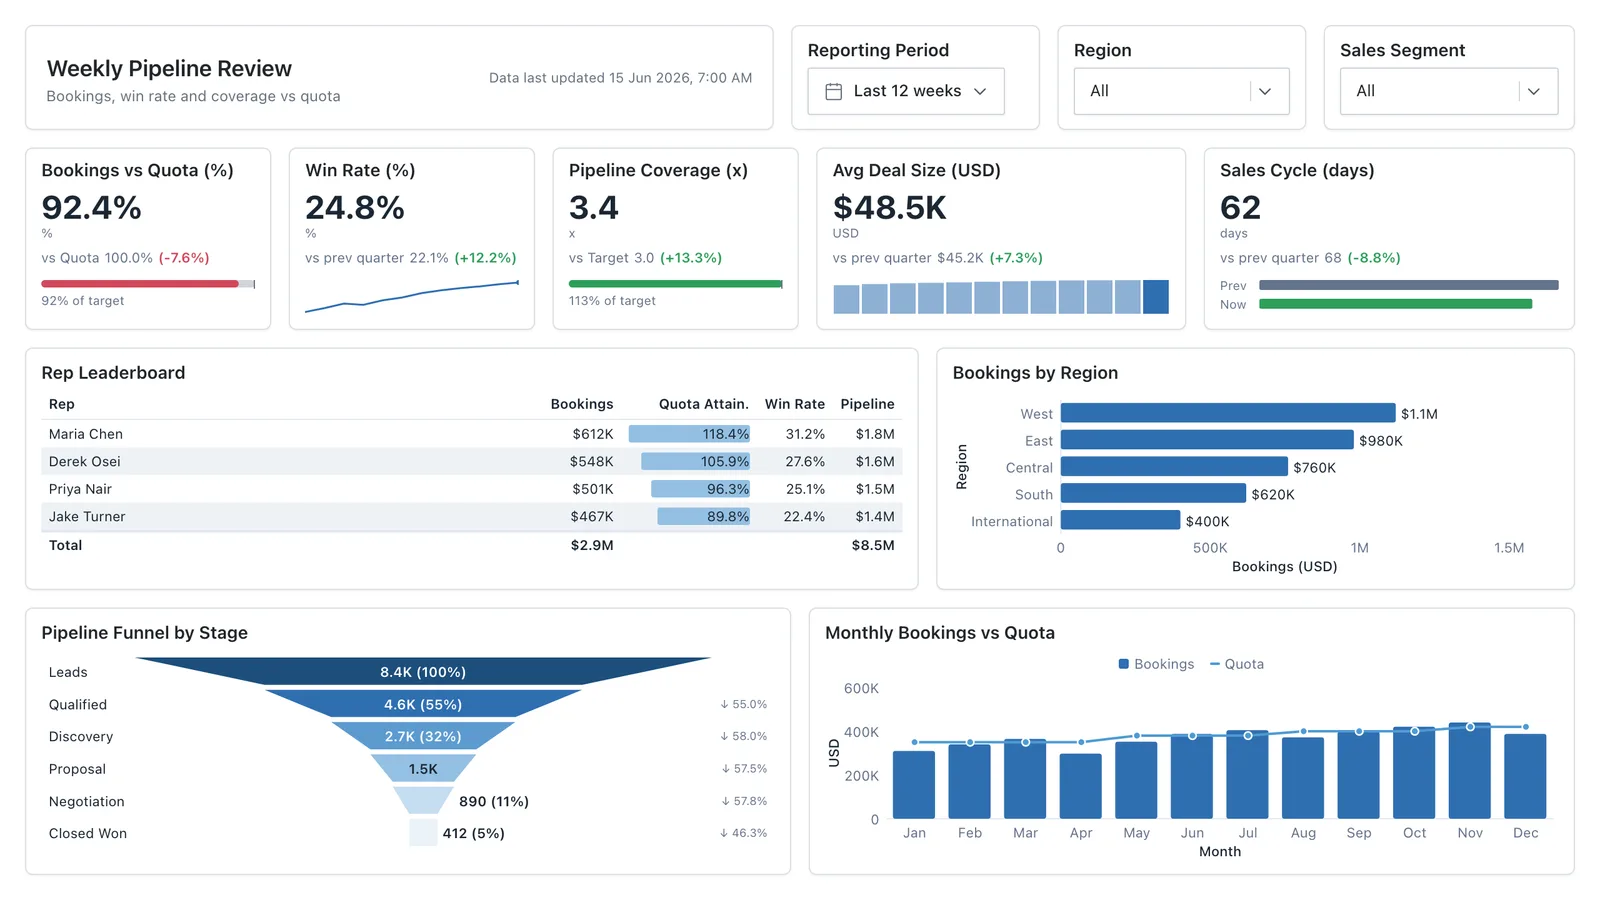
Revenue, win rate, pipeline value, and rep performance across regions — the layout most sales teams build first.
Sales Pipeline
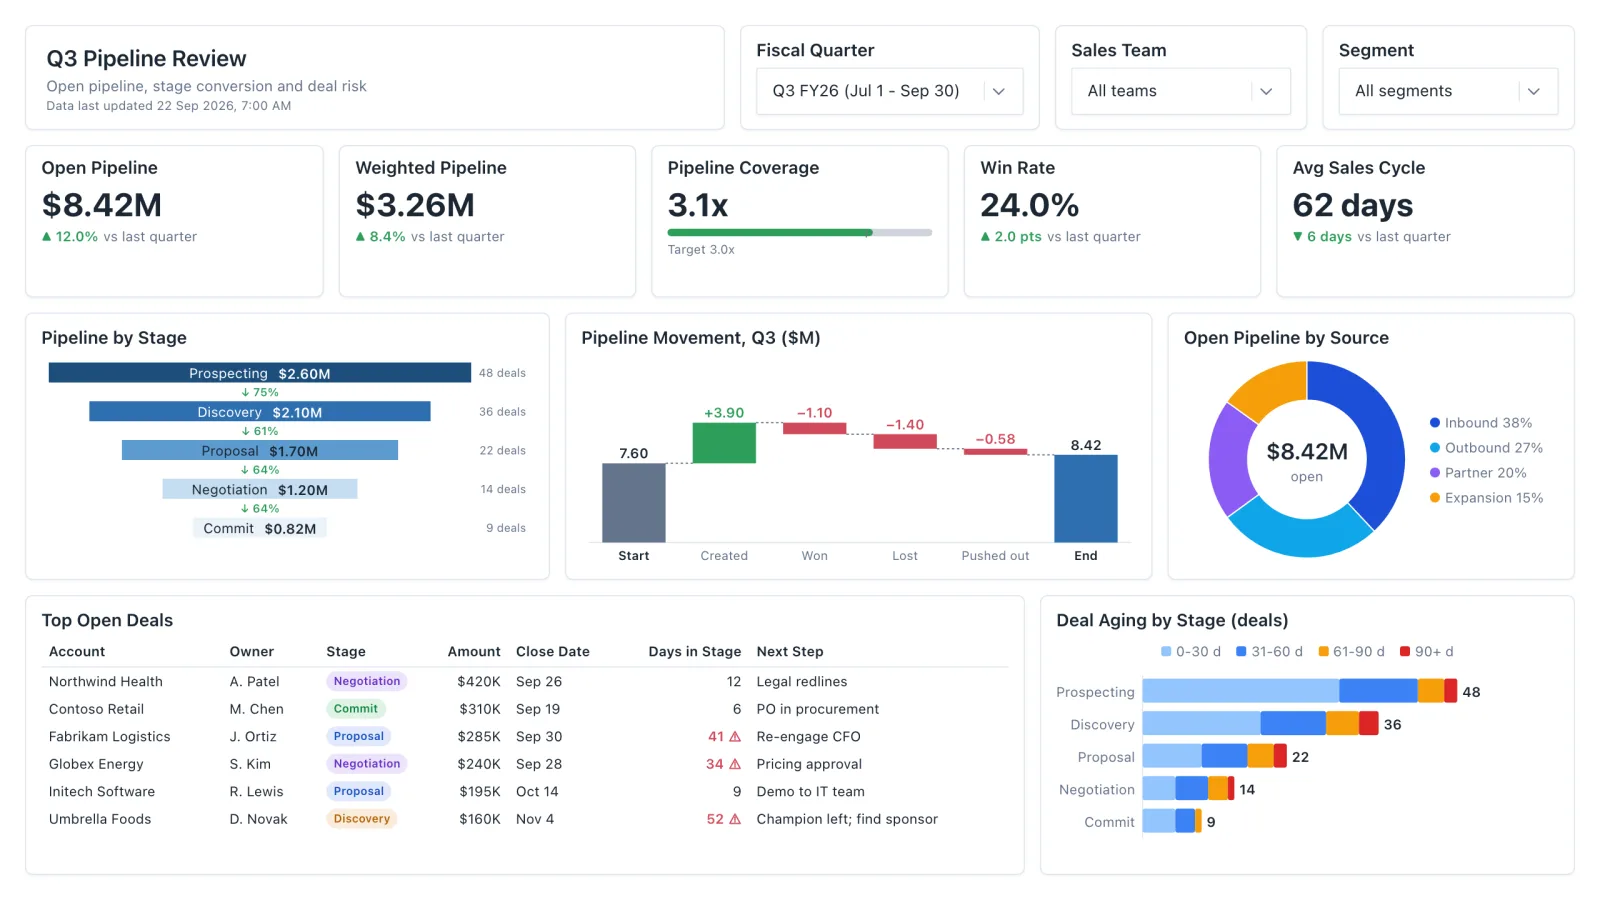
Sales pipeline dashboard with open and weighted pipeline, coverage vs target, a stage funnel and stale-deal flags.
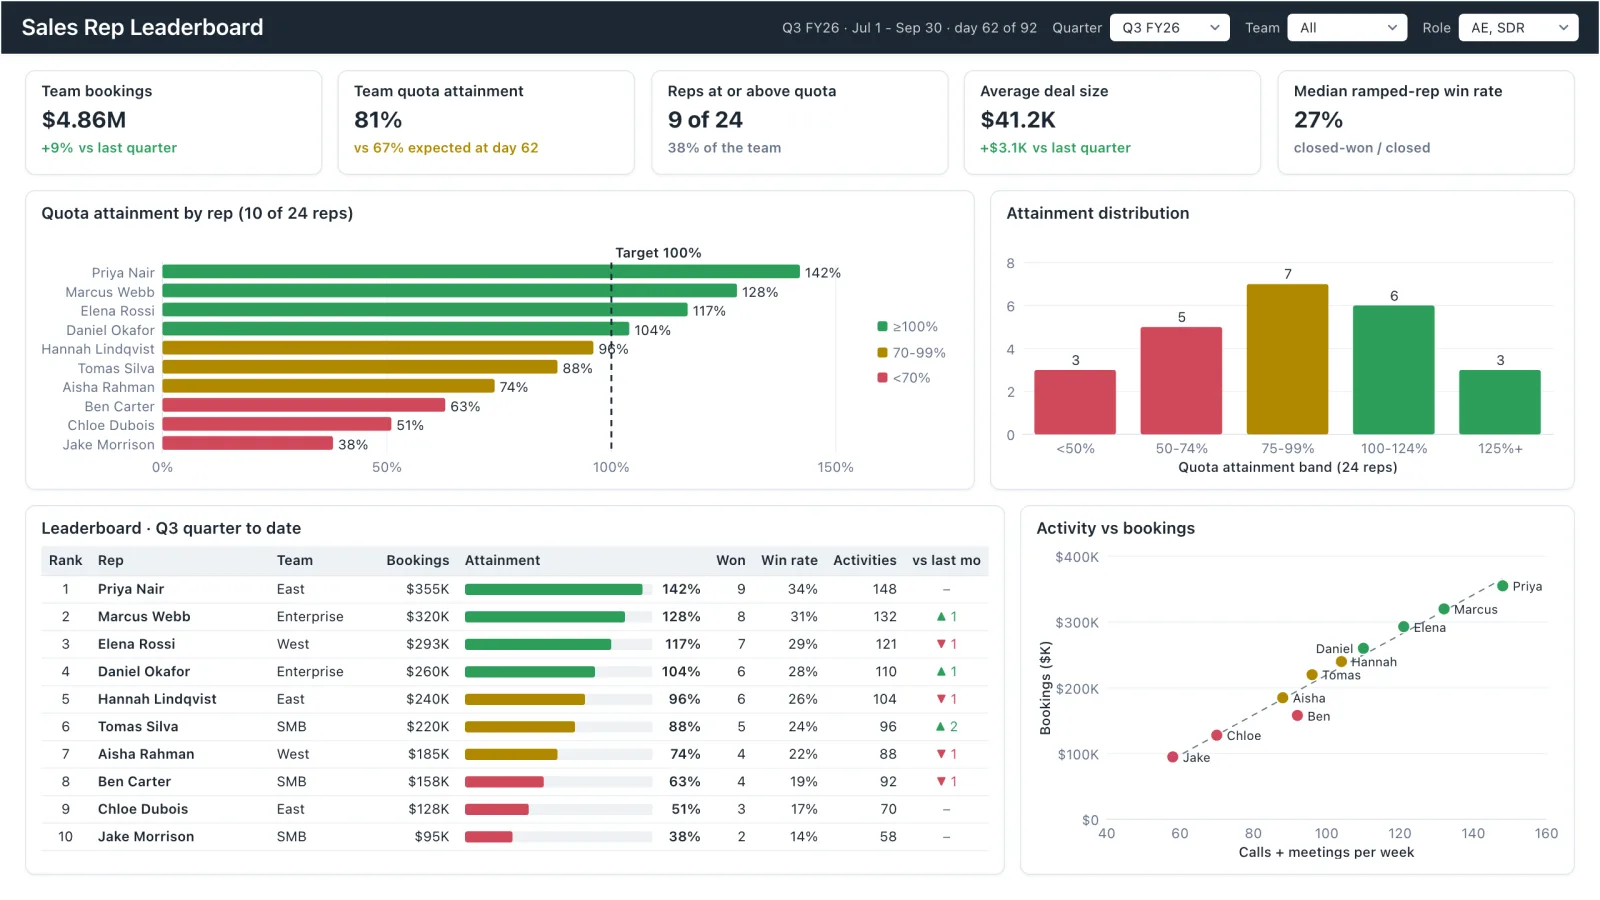
Sales Rep Leaderboard
Sales rep dashboard example with quota attainment by rep, a ranked leaderboard table and activity vs bookings.
Sales, finance, HR, SaaS, and more — filter by team or search by metric.