What a calculated field does
Your data has fields like Sales and Profit. A calculated field adds one that isn’t in the data, built from a formula. It lives in the workbook, not in the source, so the database stays untouched.
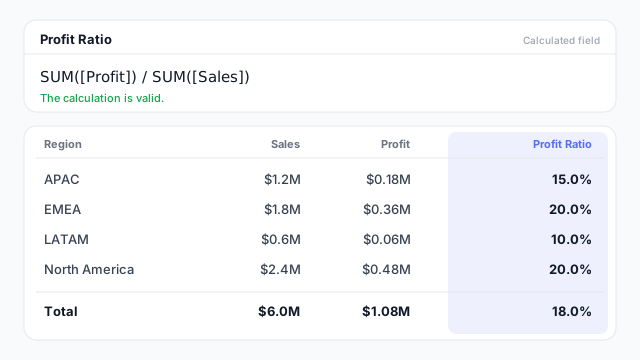
The example above is a Profit Ratio:
SUM([Profit]) / SUM([Sales])
It’s used like any other field: drag it into a view and Tableau calculates it for whatever the view is split by. With Region in the view it gives one ratio per region, and the overall ratio in the total.
Kinds of calculation
- Row-level. Calculated once per record before anything is totalled, such as
[Sales] - [Cost], or a text clean-up.
- Aggregate. Calculated on totals, such as
SUM([Profit]) / SUM([Sales]).
- Logic.
IF, CASE and similar, for flags and groupings, for example labelling orders “Large” or “Small”.
- Table calculations. Calculated on the results already in the view, for running totals or ranks. This is a different family with its own rules.
- Level of detail (LOD). Calculated at a level you choose, which has its own entry.
Ratio of sums, not average of ratios
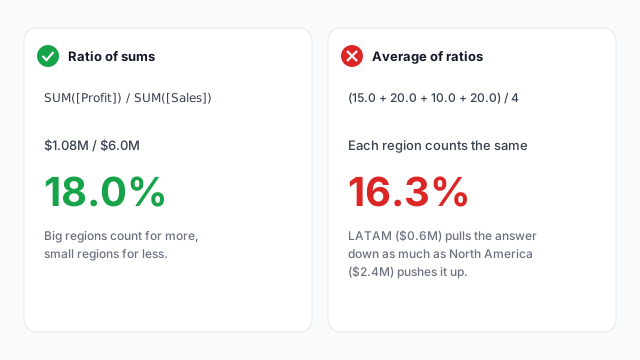
The most common mistake is averaging ratios. Averaging the four regional ratios (15%, 20%, 10%, 20%) gives 16.3%, which treats LATAM’s $0.6M the same as North America’s $2.4M. Dividing the totals gives the true 18.0%. Aggregate the numerator and denominator first, then divide.
Calculated fields in Power BI vs. Tableau
| Tableau | Power BI |
|---|
| Language | Tableau calculation syntax | DAX |
| Where you write it | In a worksheet’s Data pane | In the model, as a measure or column |
| Row-level vs. aggregate | Set by whether you aggregate in the formula | A measure vs. a calculated column |
Best practices
- Name fields for what they mean. “Profit Ratio” beats “Calculation1”, and other authors can find it.
- Aggregate before dividing. Ratios should be built from sums, as above.
- Keep formulas short. If one needs lots of nesting, split it into two fields that each do one thing.
- Handle blanks on purpose. Decide what a null should become, for example with
ZN(), which turns nulls into zero, rather than letting it ripple through.
- Check the total row. If the grand total doesn’t make sense, the formula’s level is wrong.
Mocking up calculated fields
Every number on a mockup should have a definition, and ratios are where definitions go wrong. Writing “Profit ÷ Sales, total over total” next to the KPI at the mockup stage settles it before anyone builds the field.