What it does
A normal Tableau aggregate is calculated at the level of detail of the view: put Region in the view and SUM([Sales]) gives one total per region. A level of detail (LOD) expression lets you calculate at a different level, then bring the result back into the view.
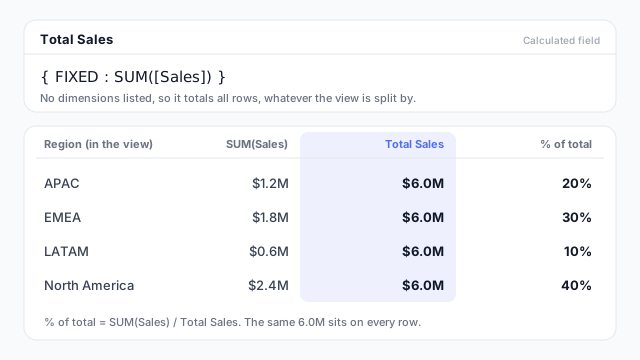
The example above is { FIXED : SUM([Sales]) }. It lists no dimensions, so it totals everything and returns the same $6.0M on every row. Dividing each region’s SUM([Sales]) by it gives percent of total: 1.2 / 6.0 = 20%, 1.8 / 6.0 = 30%, 0.6 / 6.0 = 10% and 2.4 / 6.0 = 40%, which adds up to 100%.
LOD expressions are a kind of calculated field, written inside curly braces:
{ FIXED [Customer] : MIN([Order Date]) }
FIXED, INCLUDE and EXCLUDE
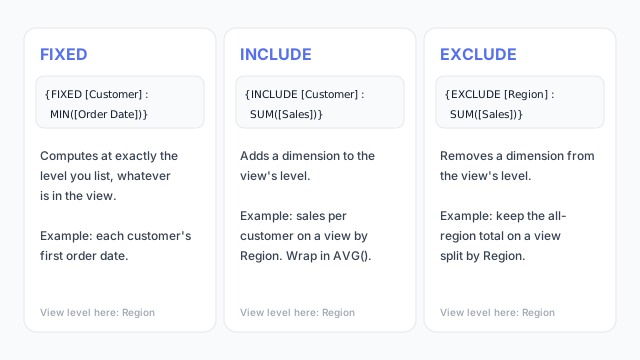
- FIXED computes at exactly the dimensions you list, whatever the view contains. Use it for values that shouldn’t move when the view changes, like a customer’s first order date.
- INCLUDE adds a dimension to the view’s level. Use it to work at a finer grain, such as sales per customer, then aggregate that back up, for example the average customer spend per region.
- EXCLUDE removes a dimension from the view’s level. Use it to keep a broader total, such as the all-region total, on a view split by region.
Common uses
- Percent of total. As above, a fixed total as the denominator.
- First or latest event per customer. The first purchase date, from which cohorts are built.
- Average of per-customer totals. Total per customer first, then average, rather than averaging individual orders.
- Comparing to a benchmark. Show each region next to a company-wide figure.
In Power BI vs. Tableau
Power BI has no LOD keywords. The nearest equivalents are DAX measures that change the filter context, for instance with CALCULATE, which is a different mechanism that reaches many of the same results.
Best practices
- Start from the question. Say “what level should this number be at?” before writing the expression.
- Prefer FIXED when the value shouldn’t move. It’s easier to reason about because it doesn’t depend on the view.
- Remember filters. A regular dimension filter doesn’t change a FIXED result. If you need it to, make the filter a context filter.
- Name them by level. “Sales per customer (fixed)” tells the next author what they’re looking at.
- Check the grain of your data. Many LOD problems are really a fact-and-dimension table question: what does one row represent?
Mocking up LOD-based numbers
A percent of total or a customer-level average looks simple on a mockup. Note beside each such number what it’s a percentage of, or an average over, so whoever builds it picks the right level. The mockup guide covers what to put on one.