How they differ
When you connect Tableau to data, you choose how it reads it.
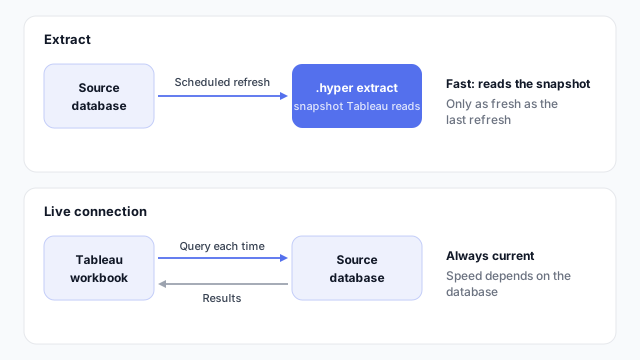
- Live connection. Tableau sends a query to the source database each time a view loads or a filter changes, and draws the results. What you see is as current as the database.
- Extract. Tableau saves a snapshot of the data in its own
.hyper file and reads from that. It’s only as fresh as the last refresh, which you run manually or on a schedule.
| Extract | Live connection |
|---|
| Where the data is read from | The saved snapshot | The source database |
| Freshness | As of the last refresh | Current at query time |
| Speed | Fast, independent of the source | Depends on the source |
| Load on the source | Only during refresh | Every time a view loads |
An extract can also be filtered or aggregated when it’s created, which keeps it smaller and quicker than the full table.
Choosing one
- Default to an extract when daily or hourly freshness is enough, the source is slow, or you don’t want dashboard traffic hitting a production database.
- Choose live when freshness is the requirement, such as an operations screen that must reflect the last few minutes, or when the data is too large or too controlled to copy.
- Ask who owns the database before going live. Every reader’s click becomes a query, and a busy source can slow down.
- Check that the source supports extracts. A few data sources can only be connected live.
In Tableau vs. Power BI
Tableau’s extract and live connection correspond to Power BI’s Import and DirectQuery storage modes, with the same trade-off between speed and freshness. The difference is where the data model lives: Power BI keeps it in the semantic model, while a Tableau workbook defines it in the data source and its calculated fields.
Best practices
- Schedule refreshes to match how the business uses the data. A refresh at 06:00 suits a morning report; it doesn’t suit a live floor display.
- Show the refresh time. A “Data as of” label on the dashboard stops people mistaking a snapshot for live data.
- Trim the extract. Keep only the columns and rows the dashboard needs.
- Test with real volumes. Live performance on a small sample can be misleading.
- Document the choice. Note which sources are extracts and which are live, and why.
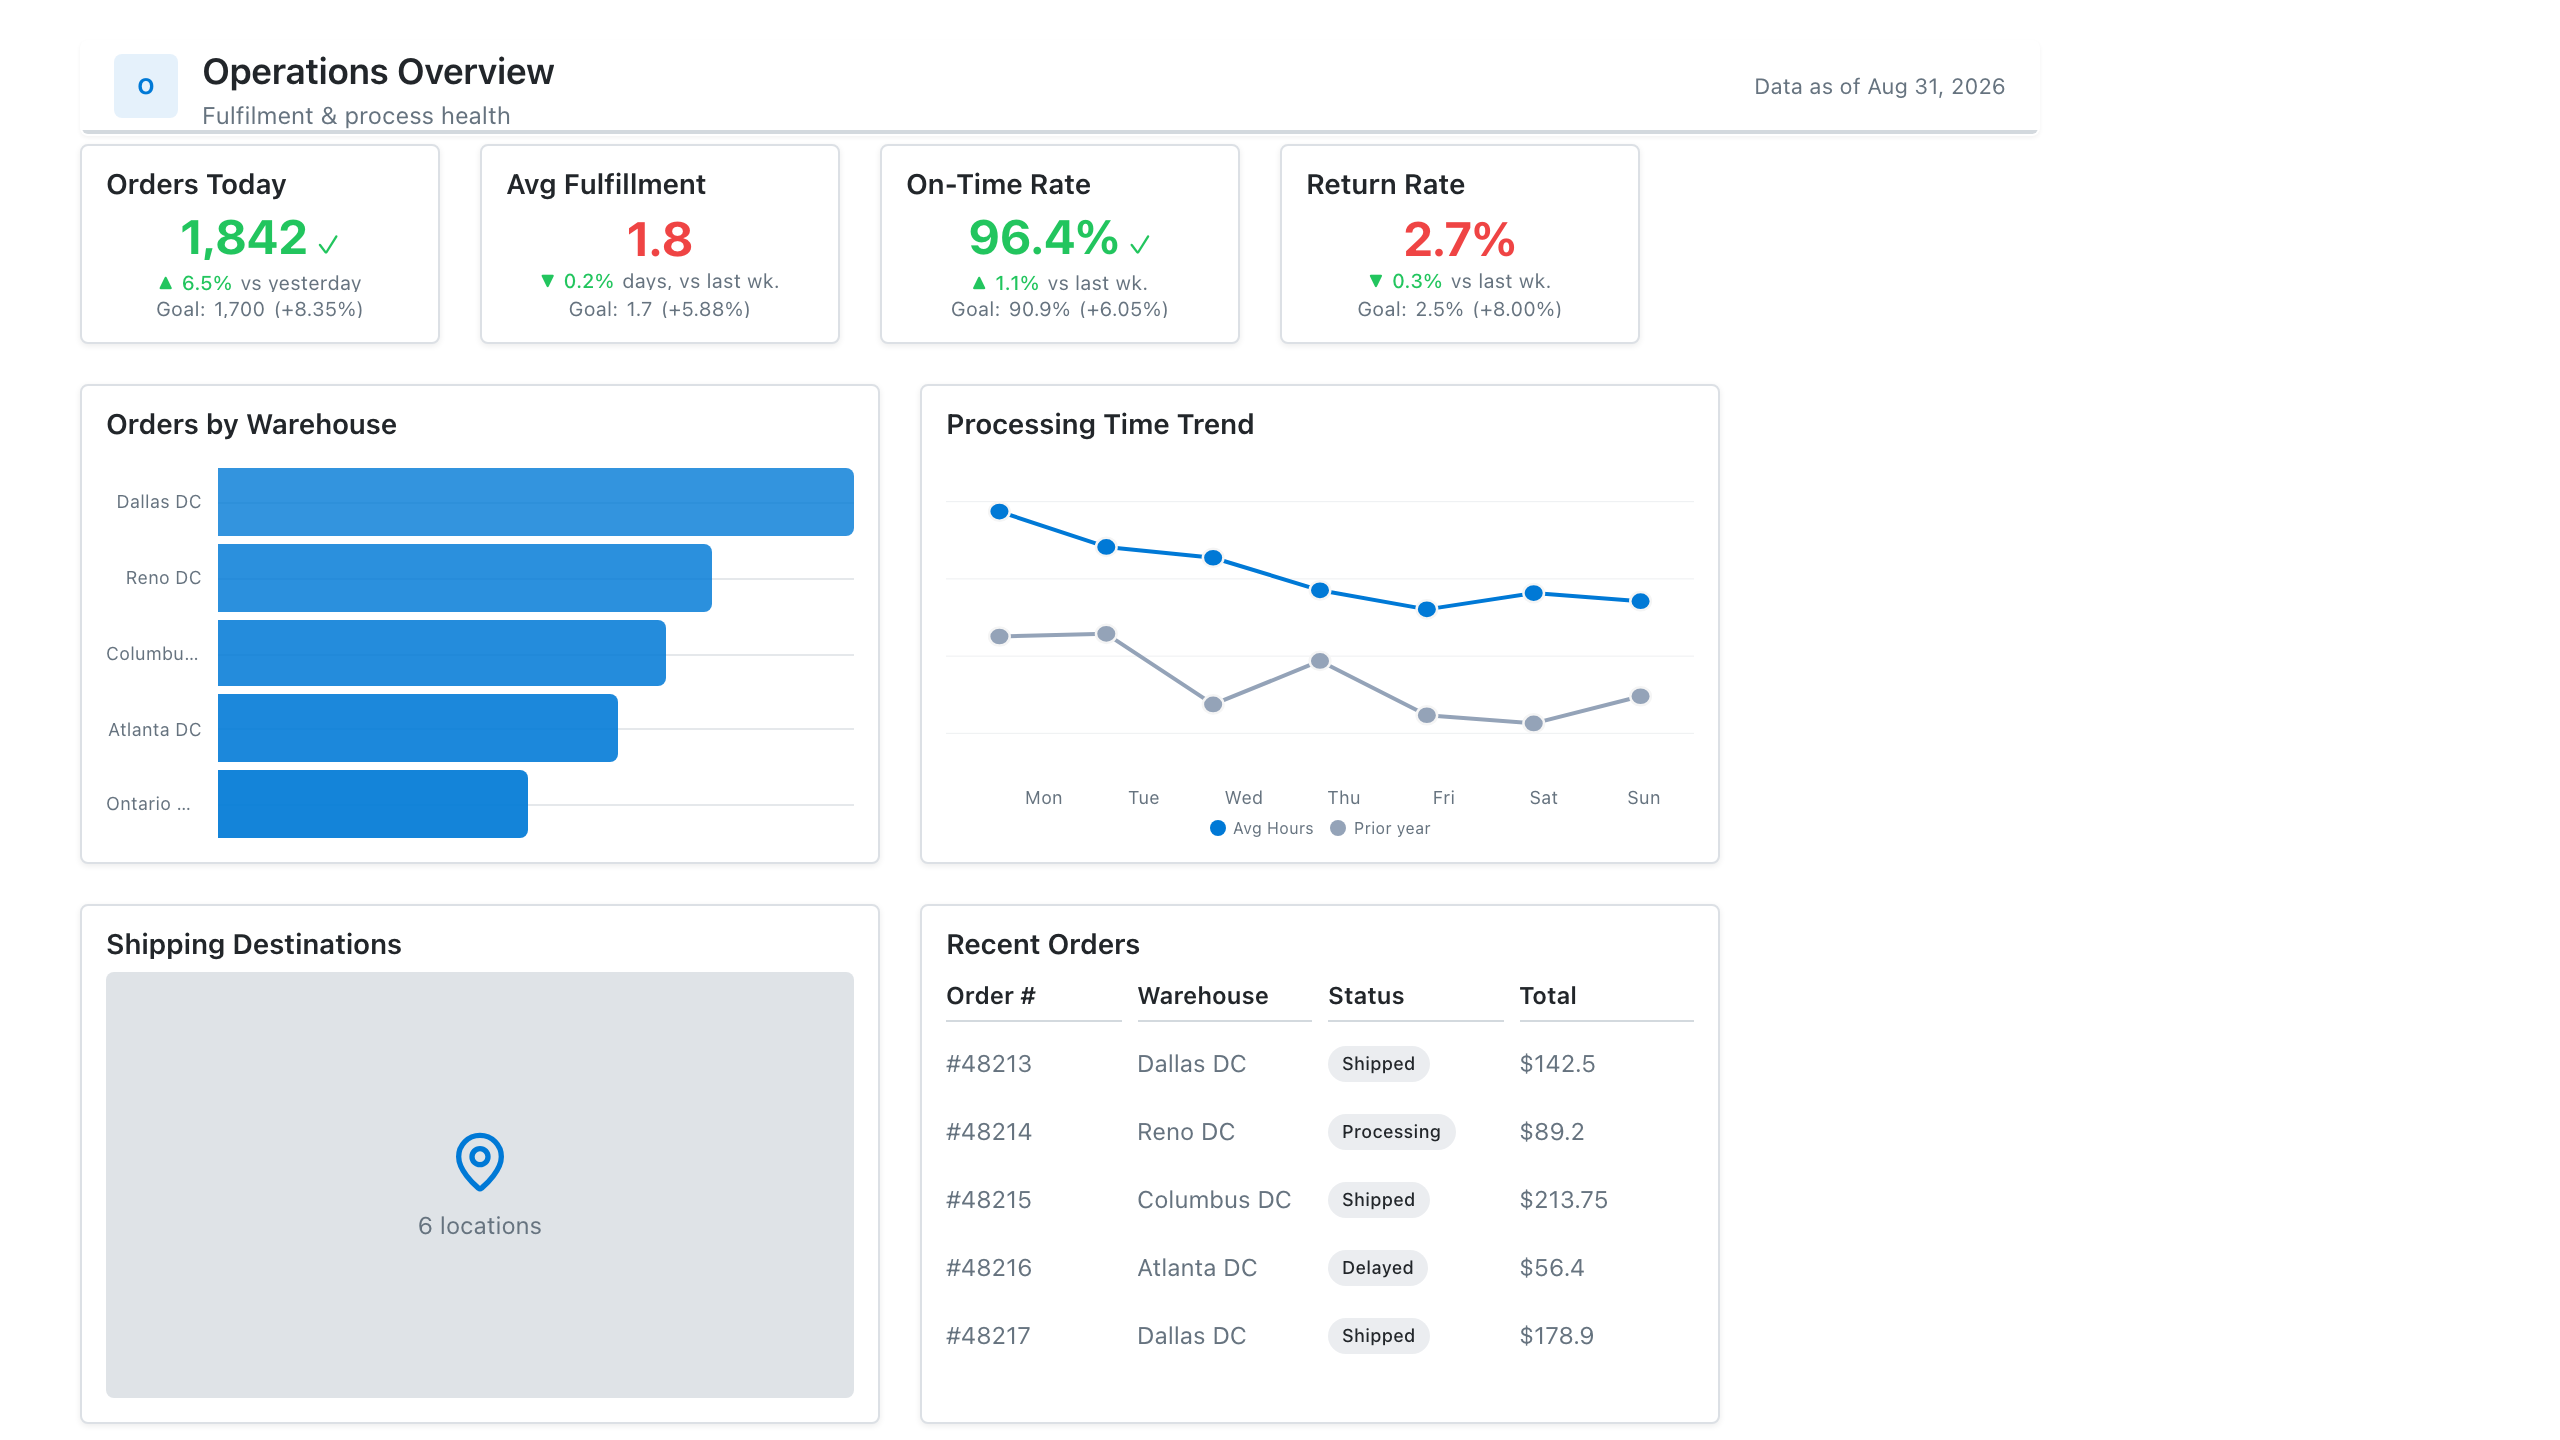
Mocking up data freshness
How fresh each number must be is a requirement you can capture on the mockup: label the visuals that need live data, and the connection choice usually follows. See why to mock up reports before you build, and the Tableau mockup process.