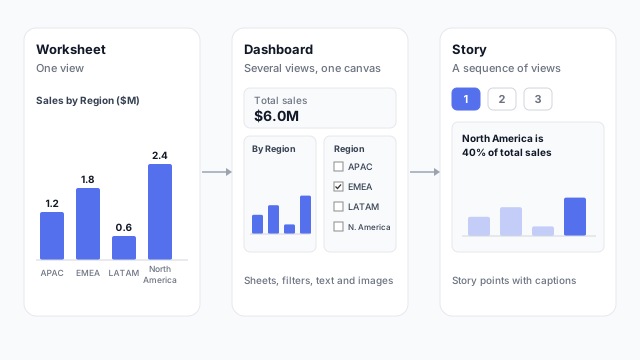
The three building blocks
A Tableau workbook is built in layers, and each layer uses the one before it.
- Worksheet. One view of the data: a bar chart, a map, a table. You build it by placing fields on the Rows, Columns and Marks. A worksheet is where every chart gets made.
- Dashboard. A canvas where you arrange worksheets alongside filters, legends, text, images and buttons. Viewers interact with all of them together.
- Story. A series of story points, each showing a worksheet or dashboard with a caption. Viewers step through them in order, like slides.
| Built for | Reader |
|---|
| Worksheet | One chart | Looks |
| Dashboard | Exploring, monitoring | Filters and clicks |
| Story | A narrative | Steps through |
How a dashboard comes together
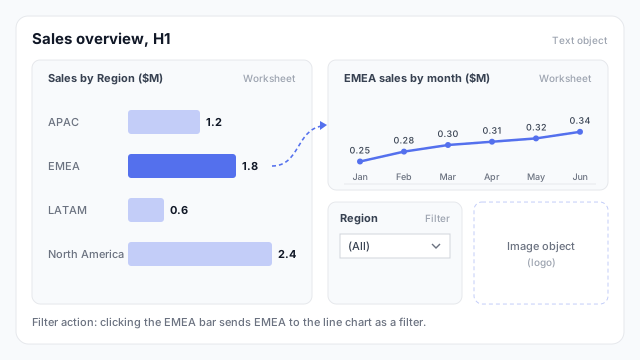
You drag worksheets onto the canvas and place them in tiled layouts, which snap into rows and columns, or floating ones, which sit anywhere. Dashboard actions connect the views: a filter action, for example, makes a click on one chart filter the others. Every worksheet on a dashboard stays editable, so a fix to the chart updates the dashboard.
When to use which
- Worksheet alone while you’re exploring data or building a single view.
- Dashboard for anything people will return to, such as monitoring and self-serve analysis.
- Story for a one-time walk-through, such as a quarterly review where you want the audience to see points in order.
Common mistakes
- Cramming everything into one dashboard. If a dashboard needs a lot of scrolling or reads as several unrelated reports, split it, or let a story carry the narrative.
- Leaving worksheets unnamed. “Sheet 14” doesn’t help the next person. Give sheets names that describe what they show.
- Using a story as a dashboard. A story is linear. Anyone who wants to explore should get a dashboard.
- Designing in the worksheet first. A chart that looks fine alone may not fit the dashboard around it.
Mocking up for Tableau
The dashboard is the layer stakeholders judge, so sketch its layout before building the worksheets that fill it. The Tableau dashboard mockup process walks through it, and a wireframe fixes the layout before any worksheet exists.