What it does
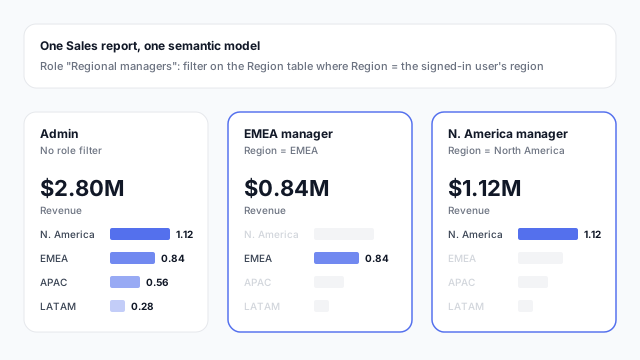
Sales managers should see their own region, not the whole company. Without security you’d build a report per region. With row-level security, you build one report and let the model decide which rows each person gets.
You define rules in roles. A role holds a filter on one or more tables, written in DAX. The example’s “Regional managers” role filters the Region table so that Region equals the signed-in manager’s region. Because relationships carry that filter to the fact table, every visual recalculates. The admin sees $2.80M, the EMEA manager $0.84M and the North America manager $1.12M, all from the same report.
Static vs. dynamic
- Static RLS puts a fixed filter in each role, such as
[Region] = "EMEA". It’s easy to understand, but you need one role per region and must edit the model when regions change.
- Dynamic RLS looks up the viewer. A DAX filter such as
[ManagerEmail] = USERPRINCIPALNAME() on a mapping table matches the person to their rows, so a single role covers everyone and access is changed by updating data, not the model.
Setting it up in Power BI
- In Power BI Desktop, choose Modeling > Manage roles and create a role.
- Add a DAX filter expression to the table to restrict.
- Test with View as to see the report as that role.
- Publish, then add users or groups to the role in the Power BI service, in the semantic model’s security settings.
Things to know
- RLS belongs to the semantic model, so it protects every report built on that model.
- It filters rows only. To hide columns or tables from some users, you need object-level security.
- It restricts people with the Viewer role; users who can edit the workspace aren’t restricted.
- Filters flow along relationships, so test totals with several roles.
Row-level security vs. Tableau
Tableau handles the same need with user filters or by filtering the data source based on the signed-in user, often with an entitlements table. The idea is the same: one workbook, different rows per person.
Best practices
- Prefer dynamic over static. One role and a mapping table scale better than a role per region.
- Filter dimensions, not facts. A filter on a small dimension is easier to read and faster to evaluate.
- Always test with View as. Check each role’s totals against what you expect.
- Use groups, not individuals. Add security groups to roles so access follows team changes.
- Document who sees what. A simple table of roles and audiences prevents surprises.
Mocking up for different audiences
If different roles will see different data, say so in the mockup. A note such as “EMEA manager view” on a page tells the model builder which rows to secure and lets reviewers check the totals. See what a dashboard mockup is.