What makes a report paginated
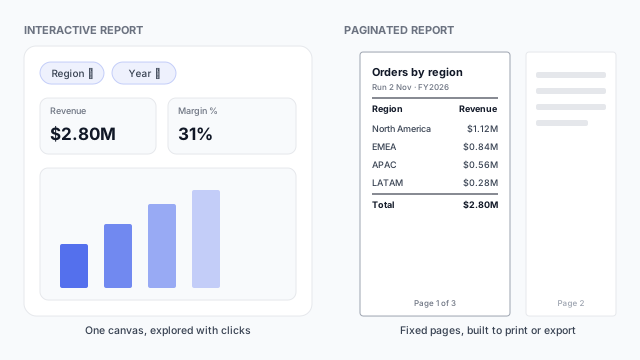
An ordinary Power BI report is a canvas: a handful of visuals on a page, filtered by clicks. A paginated report works like a document. You design the layout, and when it runs, the data is poured into that layout and divided across as many pages as it needs. A table of 2,000 rows becomes 40 pages, each with the same header and a page number.
That’s why they’re called paginated: the output is pages. The sales example shows a first page with a header, a table of orders by region totalling $2.80M, and a “Page 1 of 3” footer, with the table continuing on page 2.
Paginated vs. interactive
| Interactive report | Paginated report |
|---|
| Built for | Exploring and spotting patterns | Printing, exporting, archiving |
| Layout | Visuals on a canvas | Fixed layout, flows across pages |
| Built in | Power BI Desktop | Power BI Report Builder |
| Typical output | Screen | PDF, Excel, Word, PowerPoint |
| Best with | Summaries and charts | Detailed tables and long lists |
When to use one
- Invoices, statements and certificates that must look the same every time.
- Regulatory or audit reports where every row has to appear.
- Operational lists, such as all open orders for a warehouse.
- Scheduled PDFs sent to people who don’t open dashboards.
- Pixel-exact layouts with specific headers, footers and page breaks.
If readers need to explore, filter and compare, build an interactive report instead. Many teams use both: a dashboard to spot the issue, a paginated report as the detailed record.
How they’re built
Paginated reports use the RDL report format and come from the same family as SQL Server Reporting Services. You build them in Power BI Report Builder, a separate desktop app, using tables, matrices (like the matrix visual), charts, parameters and expressions. Data can come from a Power BI semantic model or from other supported sources. Publishing needs a workspace on paid capacity or a Premium Per User license.
Best practices
- Design for the page size. Choose paper size and margins first, then lay out the table.
- Repeat headers on each page. Long tables are unreadable without them.
- Use parameters. Let people choose the period or region before running the report.
- Test the export. Check the PDF and Excel output, not just the preview.
- Keep summaries upfront. Put totals at the top, details after.
Mocking up a paginated report
Because the layout is fixed, it pays to agree it on paper first: what’s in the header, which columns the table has and where totals go. A mockup makes that a five-minute conversation instead of a rebuild. See wireframing best practices.