Column Chart
Also called: Vertical bar chart, Clustered column chart
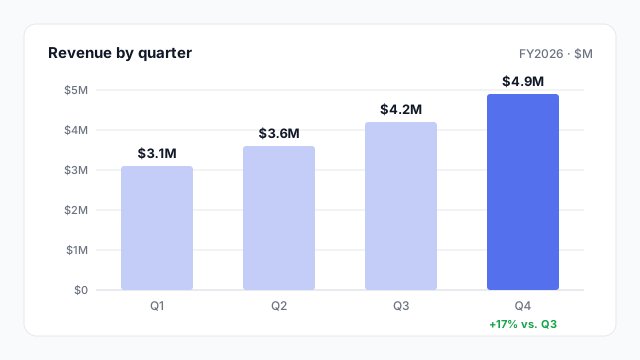
A column chart uses vertical bars to compare a measure across categories or time periods, such as revenue by quarter. Taller columns mean bigger values.
Also called: Vertical bar chart, Clustered column chart
A column chart uses vertical bars to compare a measure across categories or time periods, such as revenue by quarter. Taller columns mean bigger values.
Use a column chart when you’re comparing a few categories or discrete time periods: revenue by quarter, tickets by month, headcount by department. It’s often the right default because everyone can read it at a glance.
Switch to something else when:
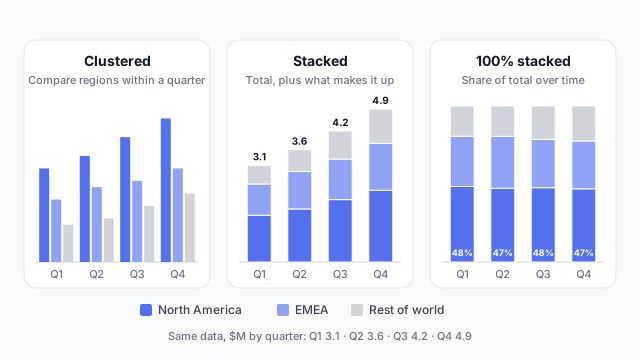
These are the three stack modes you can switch between on a column chart in Mockko.
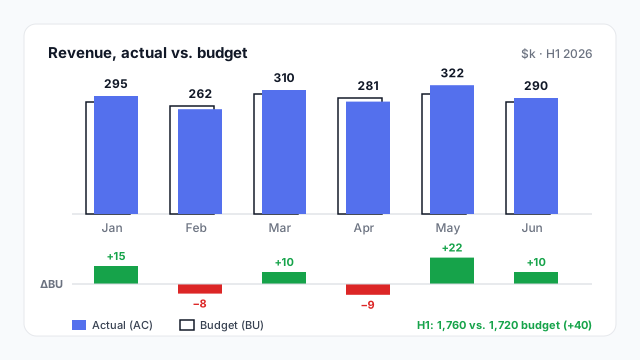
A common finance variation overlaps an outlined budget column with a solid actual column, and adds a variance row underneath. It’s the IBCS-style layout, and Mockko’s column chart has it as a built-in variant.
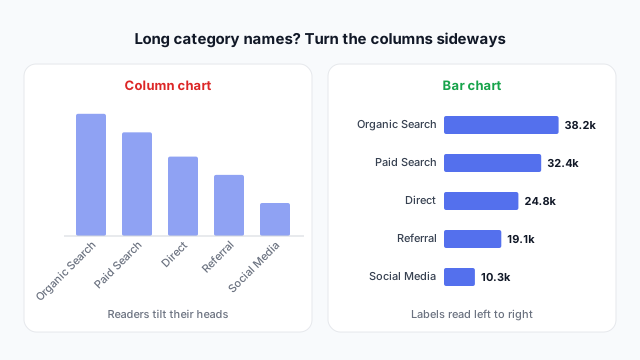
If you have to rotate the labels to fit them, the chart wants to be a bar chart.
| Power BI | Tableau | |
|---|---|---|
| Visuals | Clustered column, Stacked column, 100% stacked column | Bar mark type with the dimension on Columns |
| Stacked | Separate visual | Put a dimension on Colour |
| With a line | Line and clustered column chart (a combo chart) | Dual axis |
Most column-chart debates are about the series: stacked or clustered, which colour is “us”, whether budget shows. Settle those on a mockup, as covered in why to mock up Power BI reports before you build.
These free Mockko templates use it. Open one and edit it in your browser.
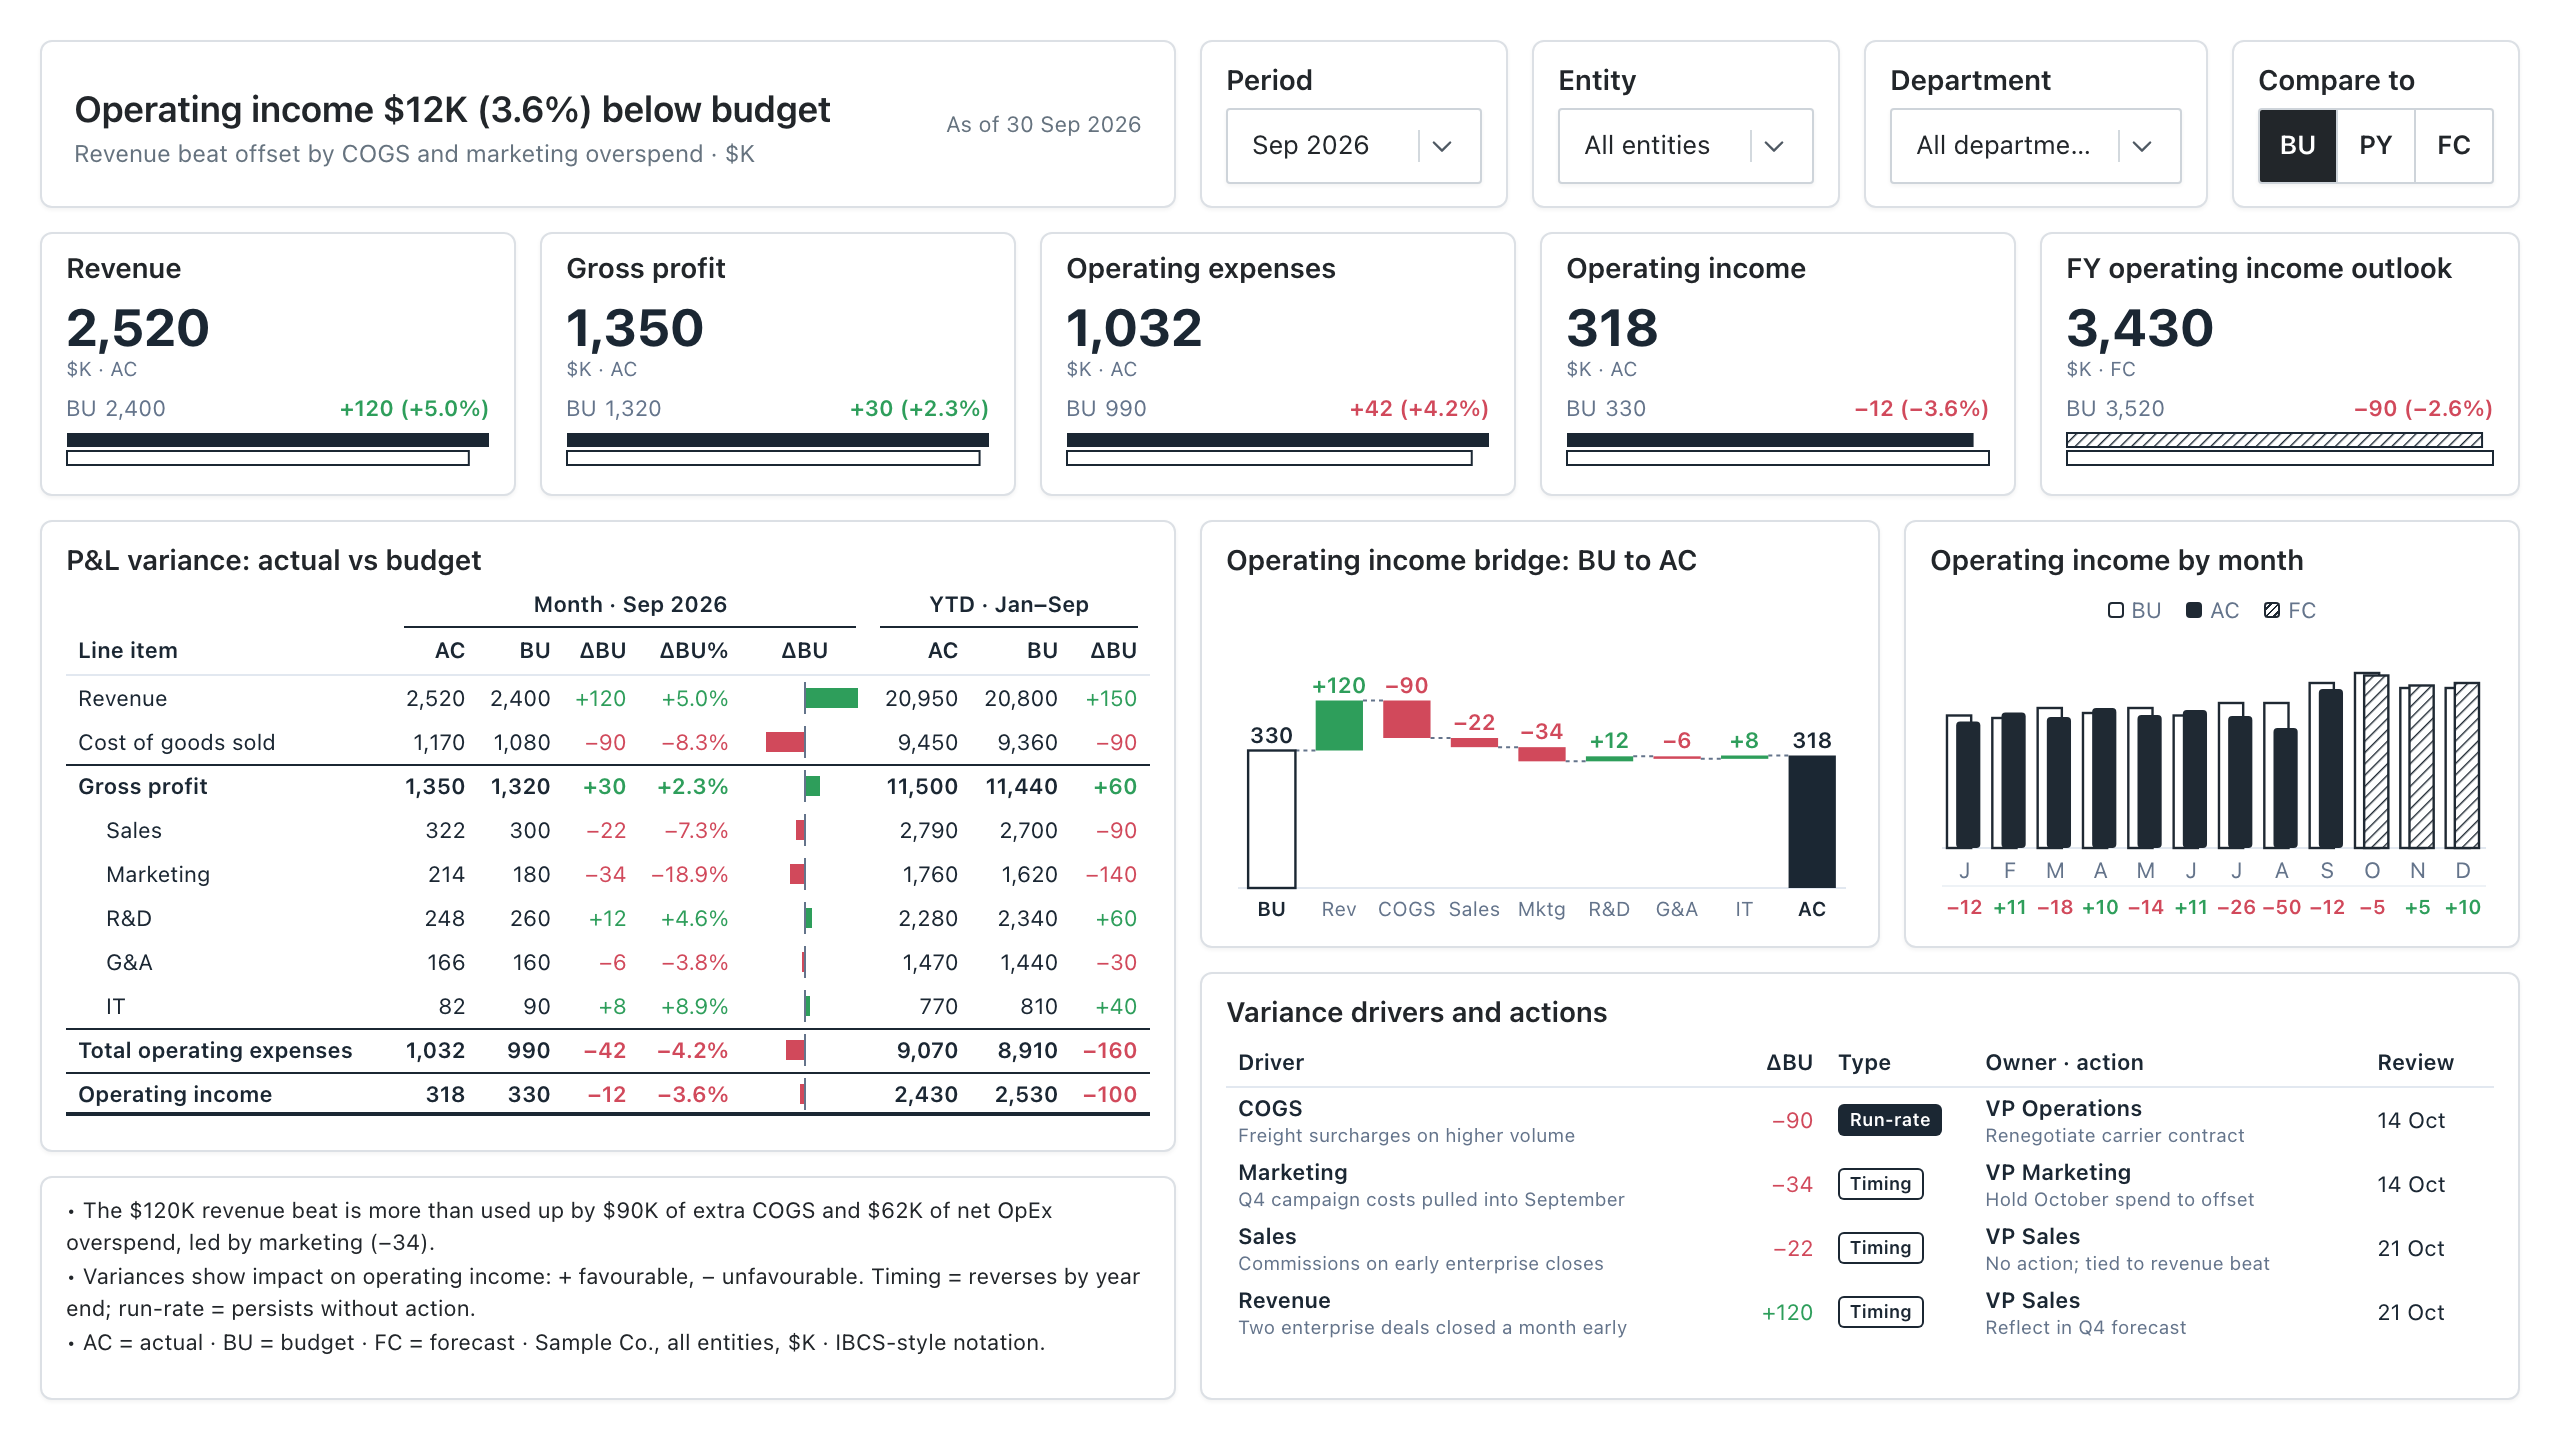
An IBCS-style variance report: P&L actual vs budget, an operating income bridge, and the drivers behind every gap.
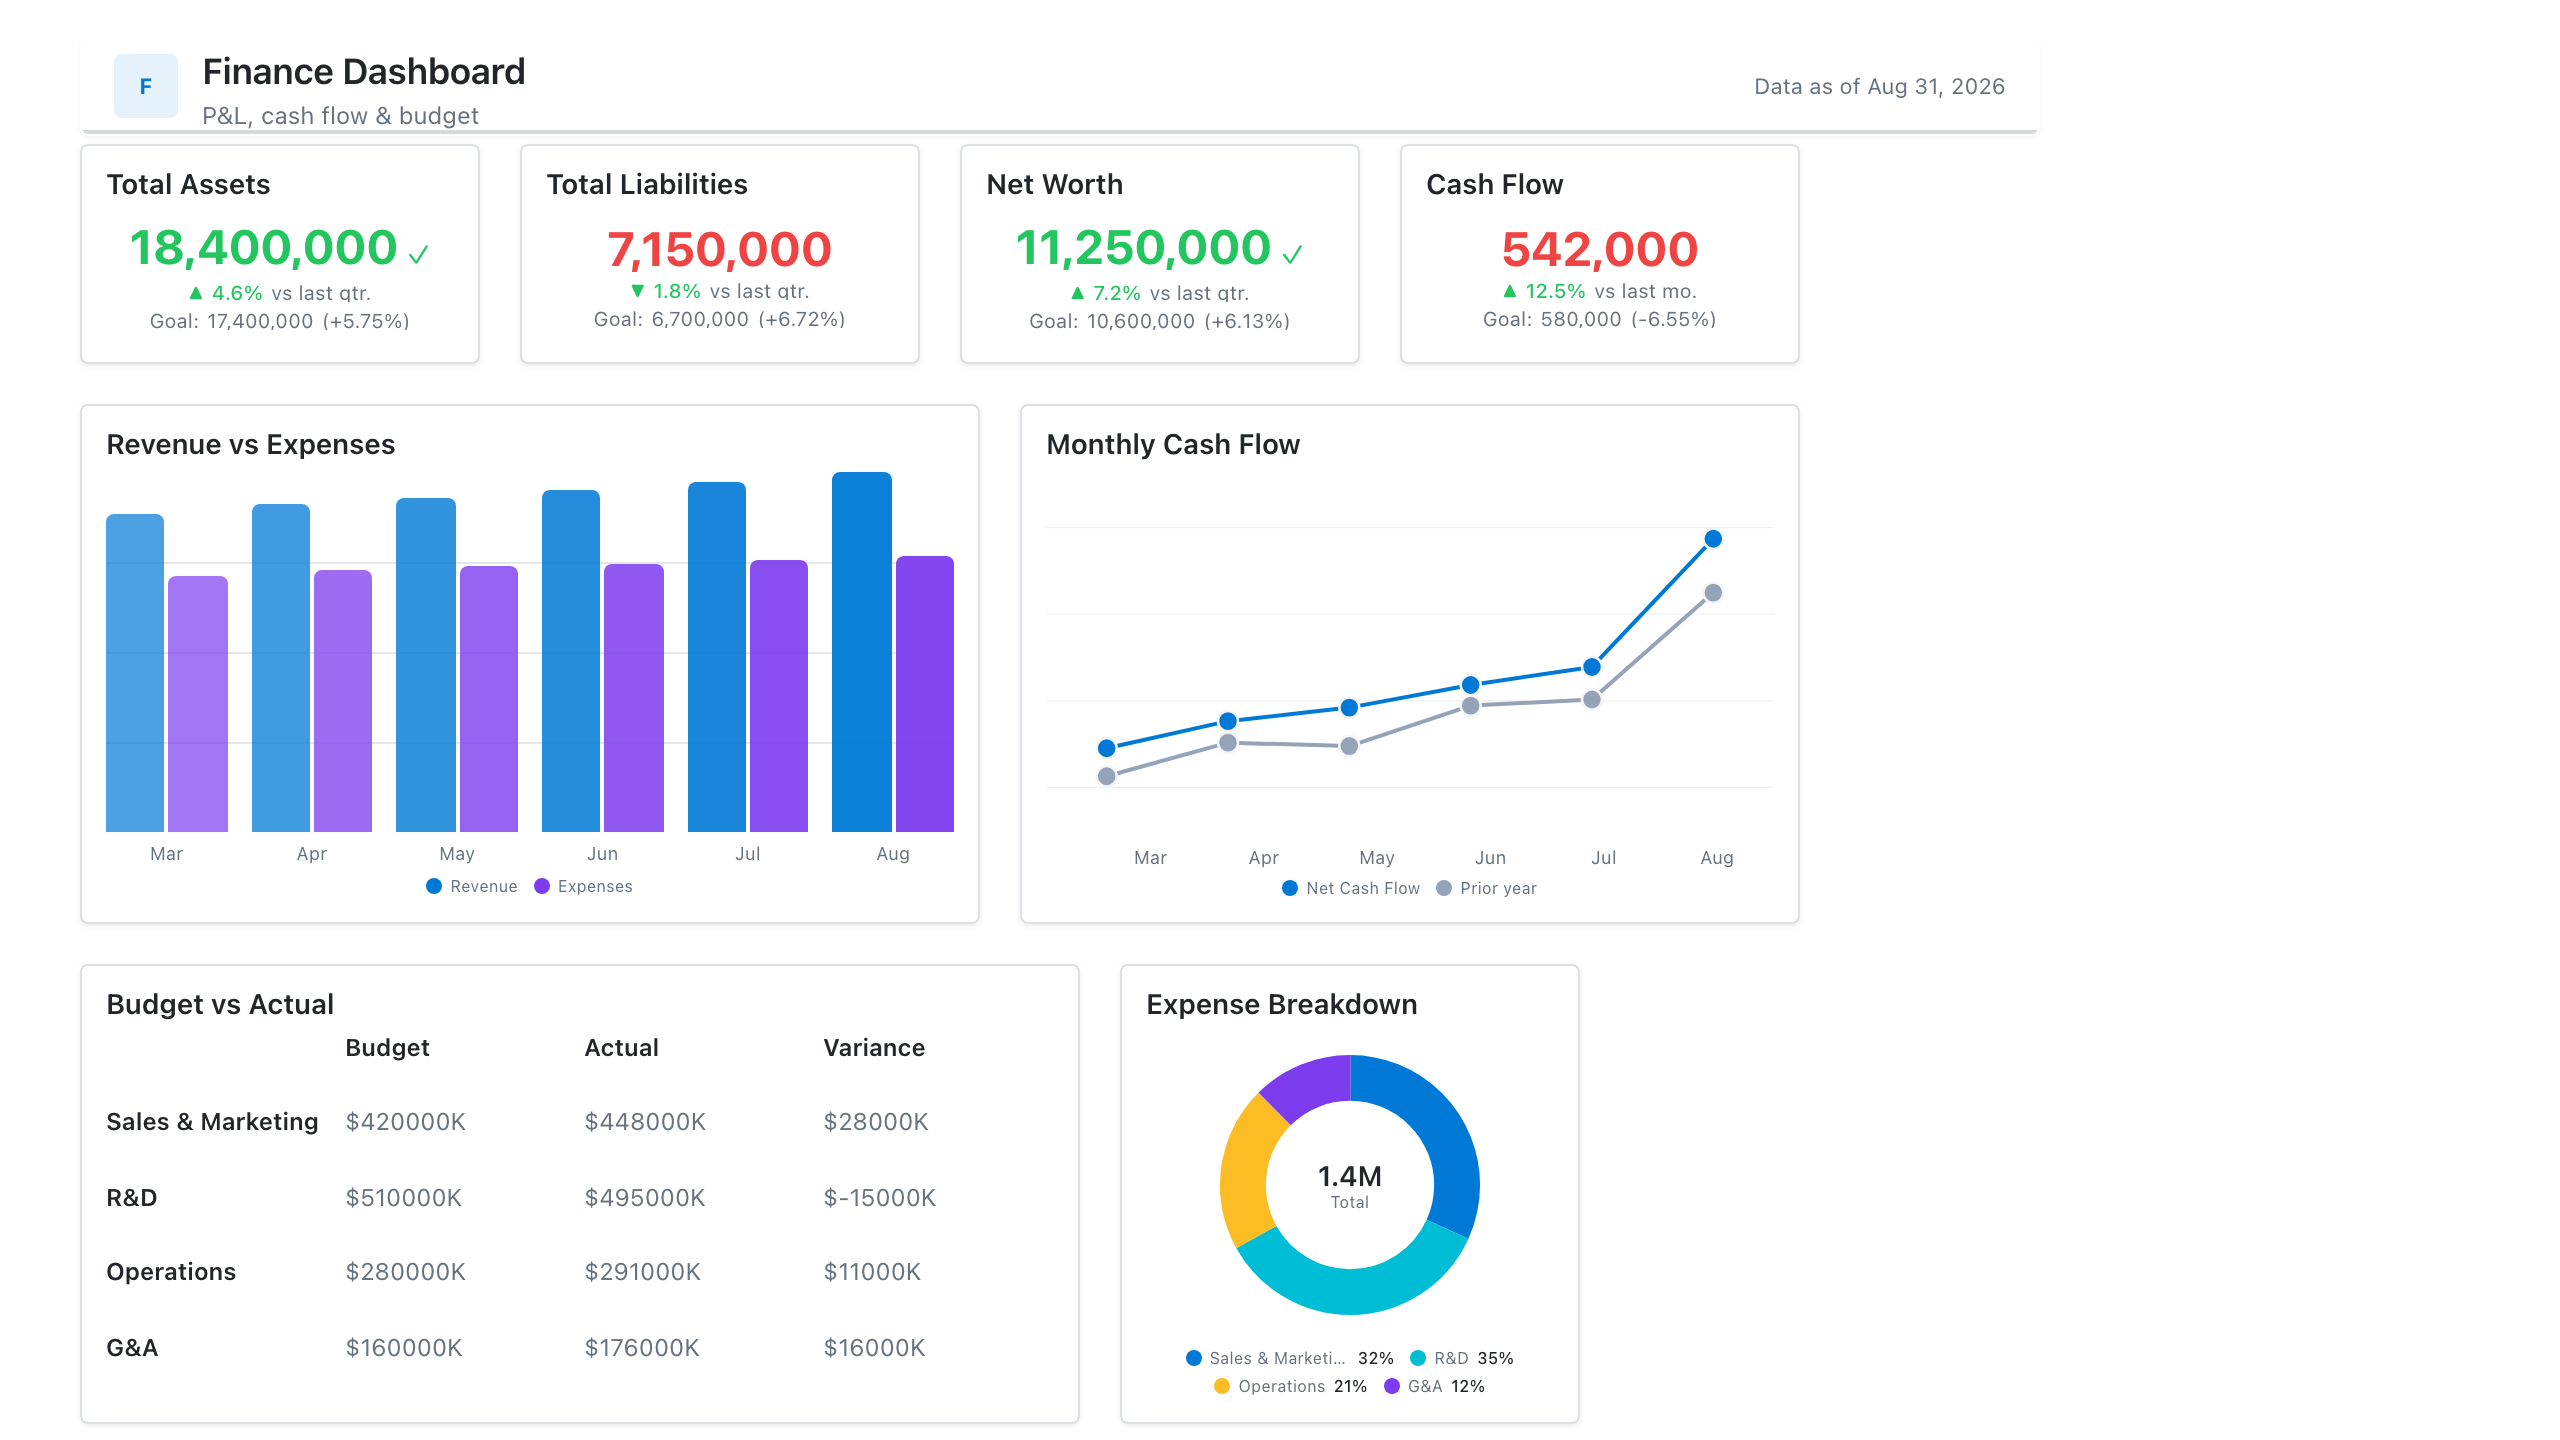
P&L summary, cash flow trends, budget vs actuals, and departmental spend, wireframed before a single DAX measure is written.
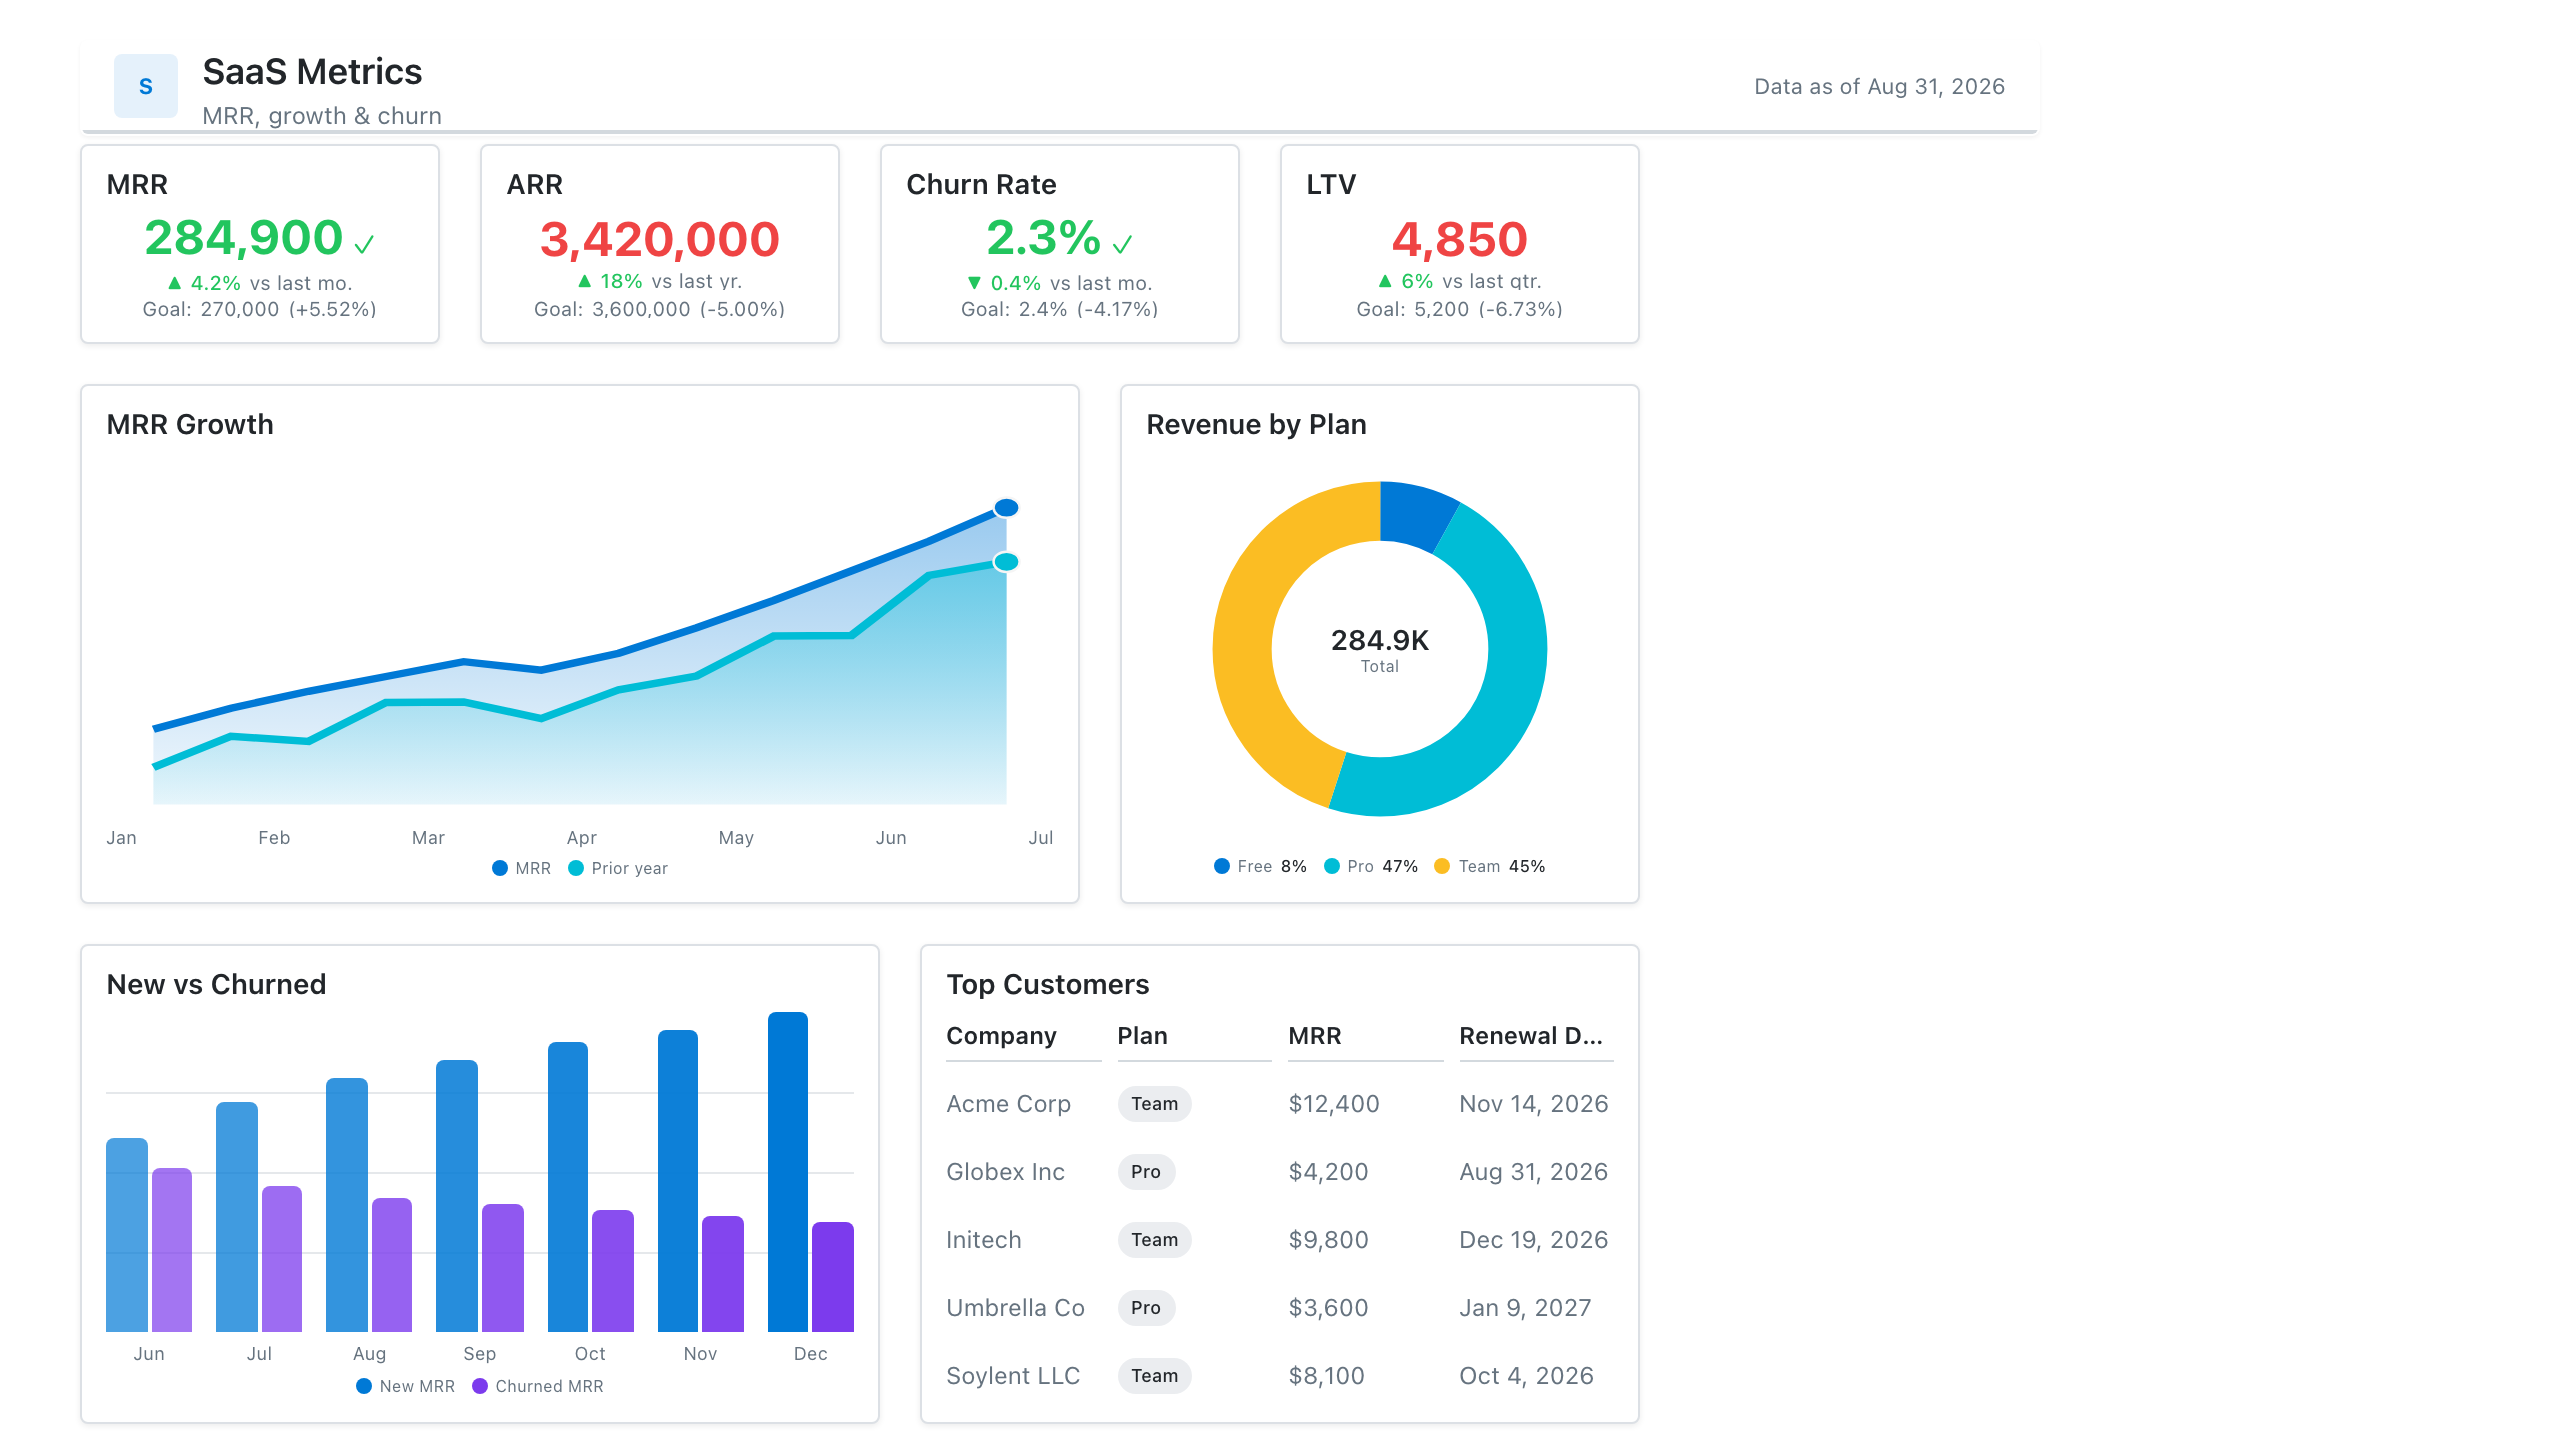
MRR, net revenue retention, churn, and activation in one subscription-metrics wireframe — the layout most SaaS teams review weekly.
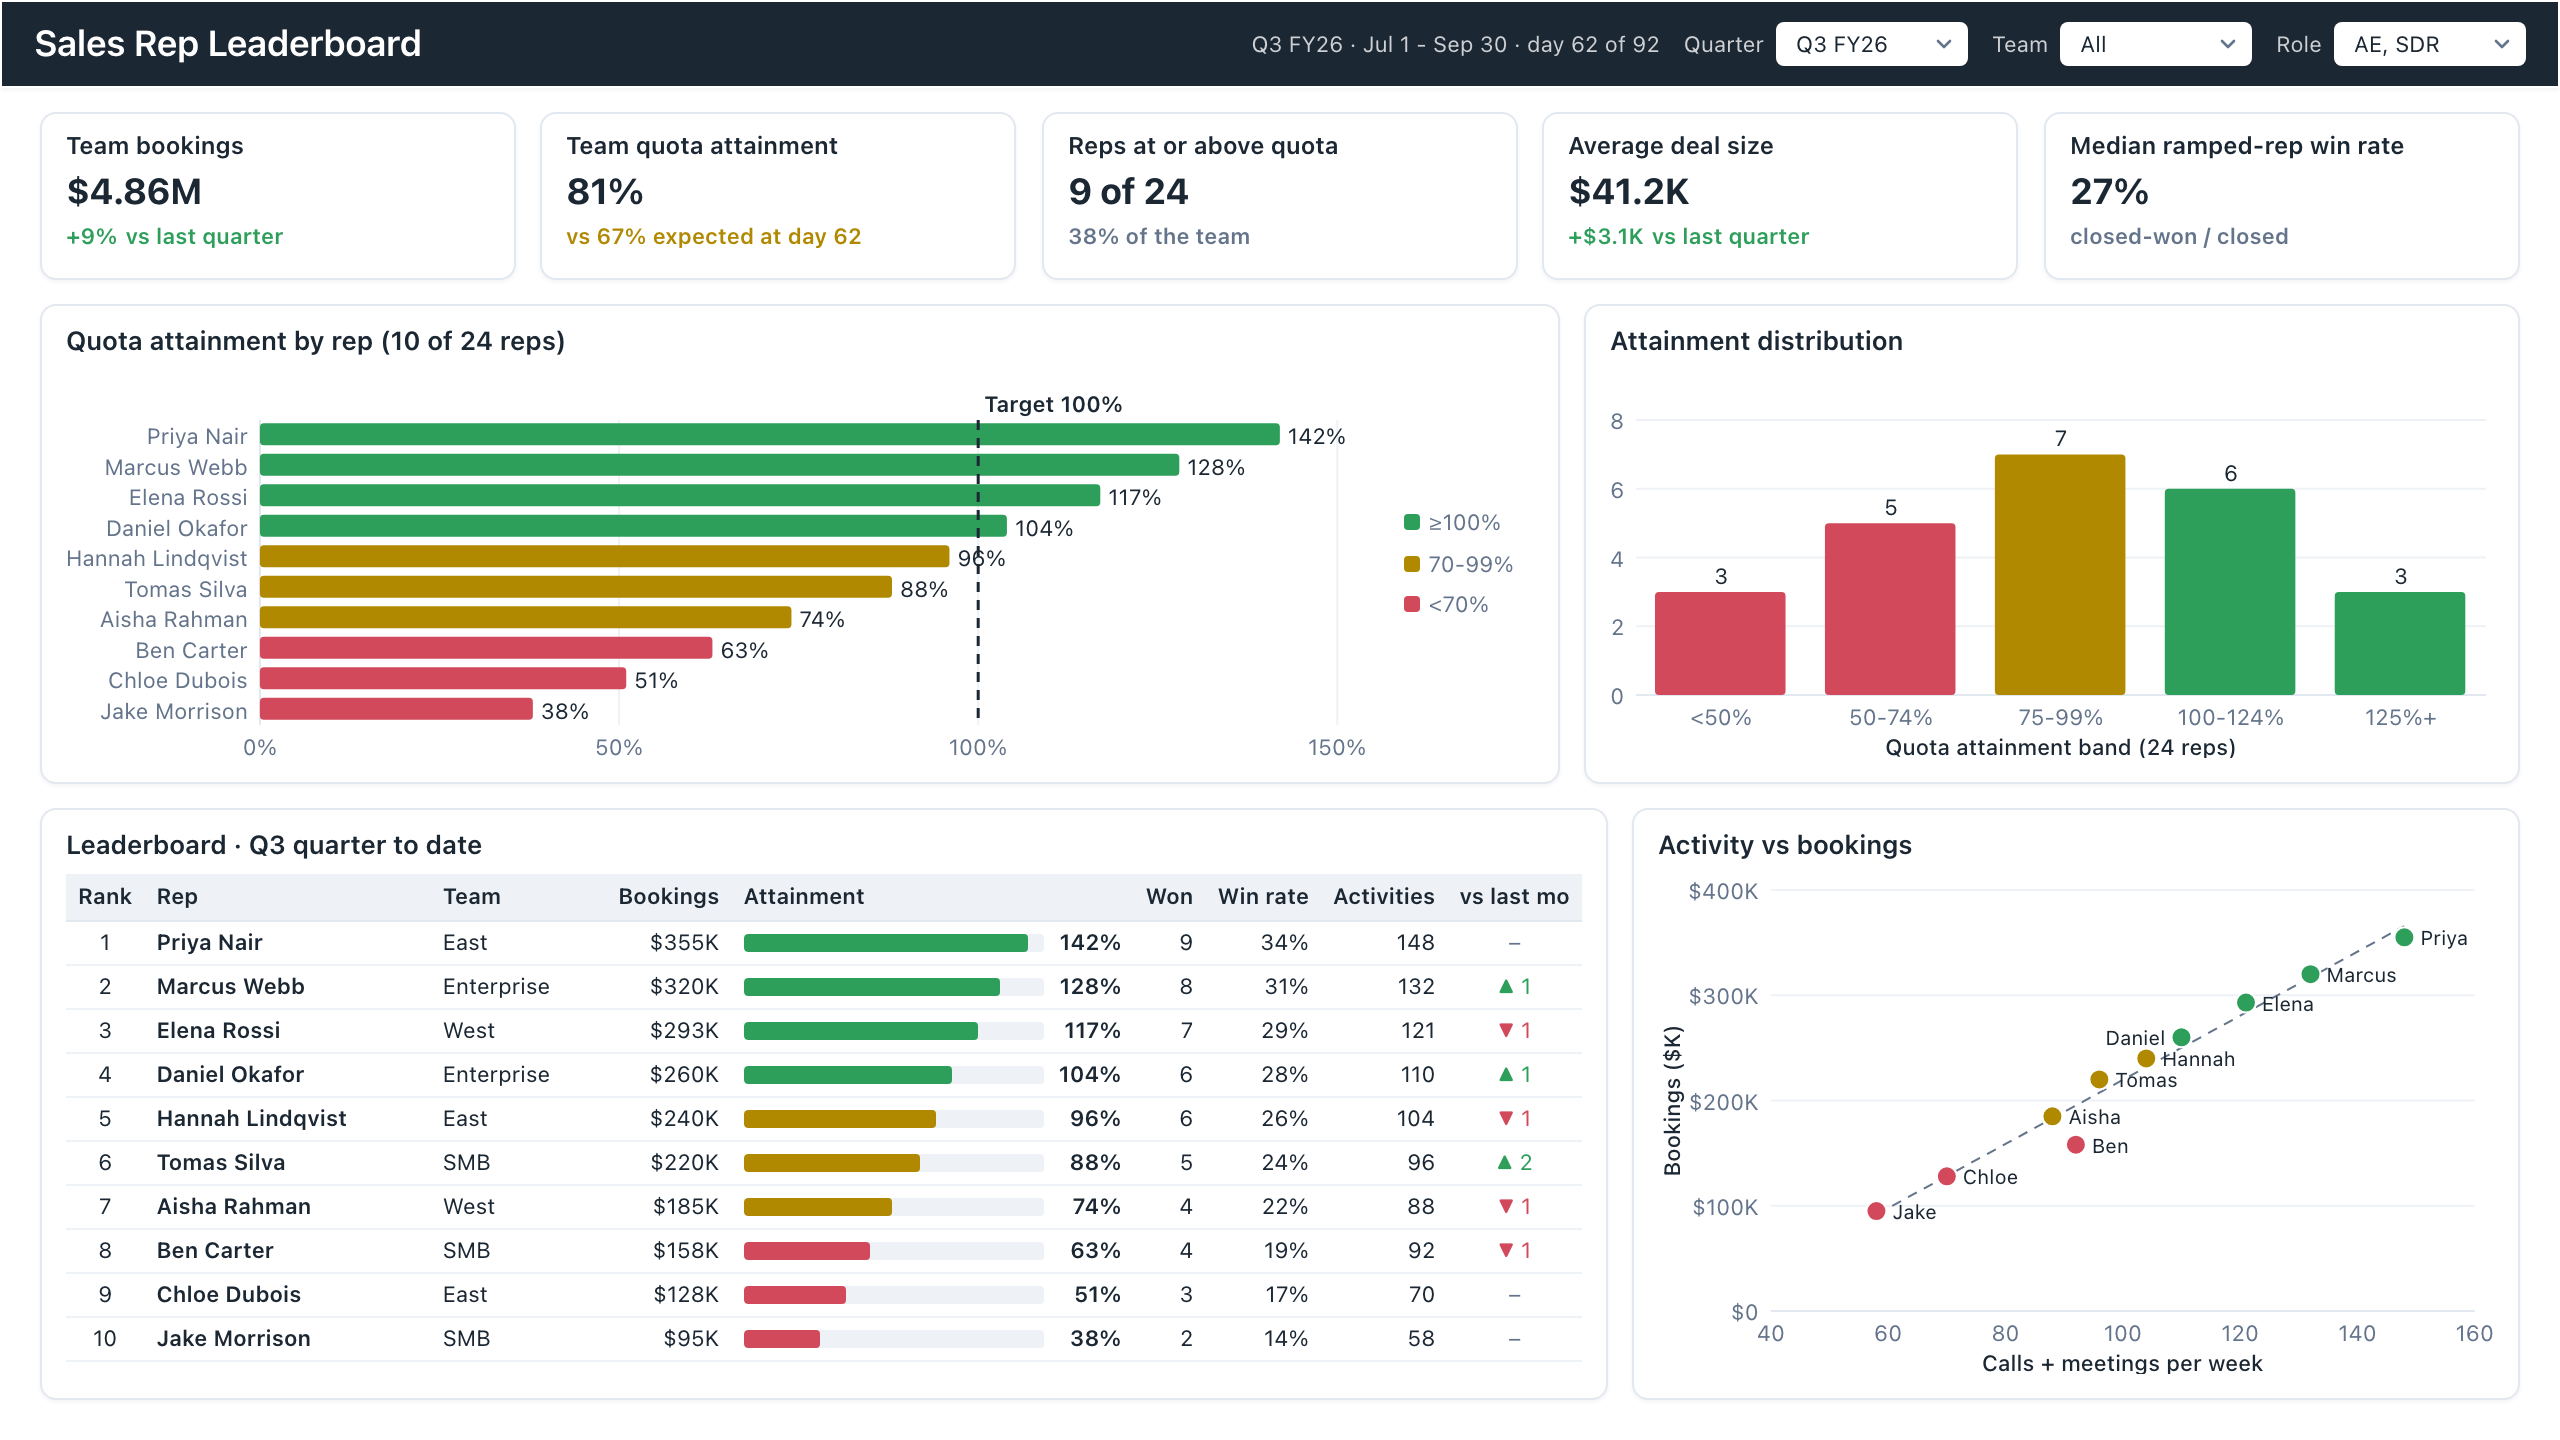
Sales rep dashboard example with quota attainment by rep, a ranked leaderboard table and activity vs bookings.
Lay out your Power BI or Tableau dashboard in Mockko, get sign-off, then build. Free to start.
Try Mockko free