Ecommerce Dashboard Mockup Template
The Ecommerce dashboard template is a one-page store performance layout for ecommerce managers and agencies, built to decide which channels, funnel steps and products are worth more attention. It shows revenue, orders, average order value, conversion rate, cart abandonment, revenue by channel, a checkout funnel and top-selling products.
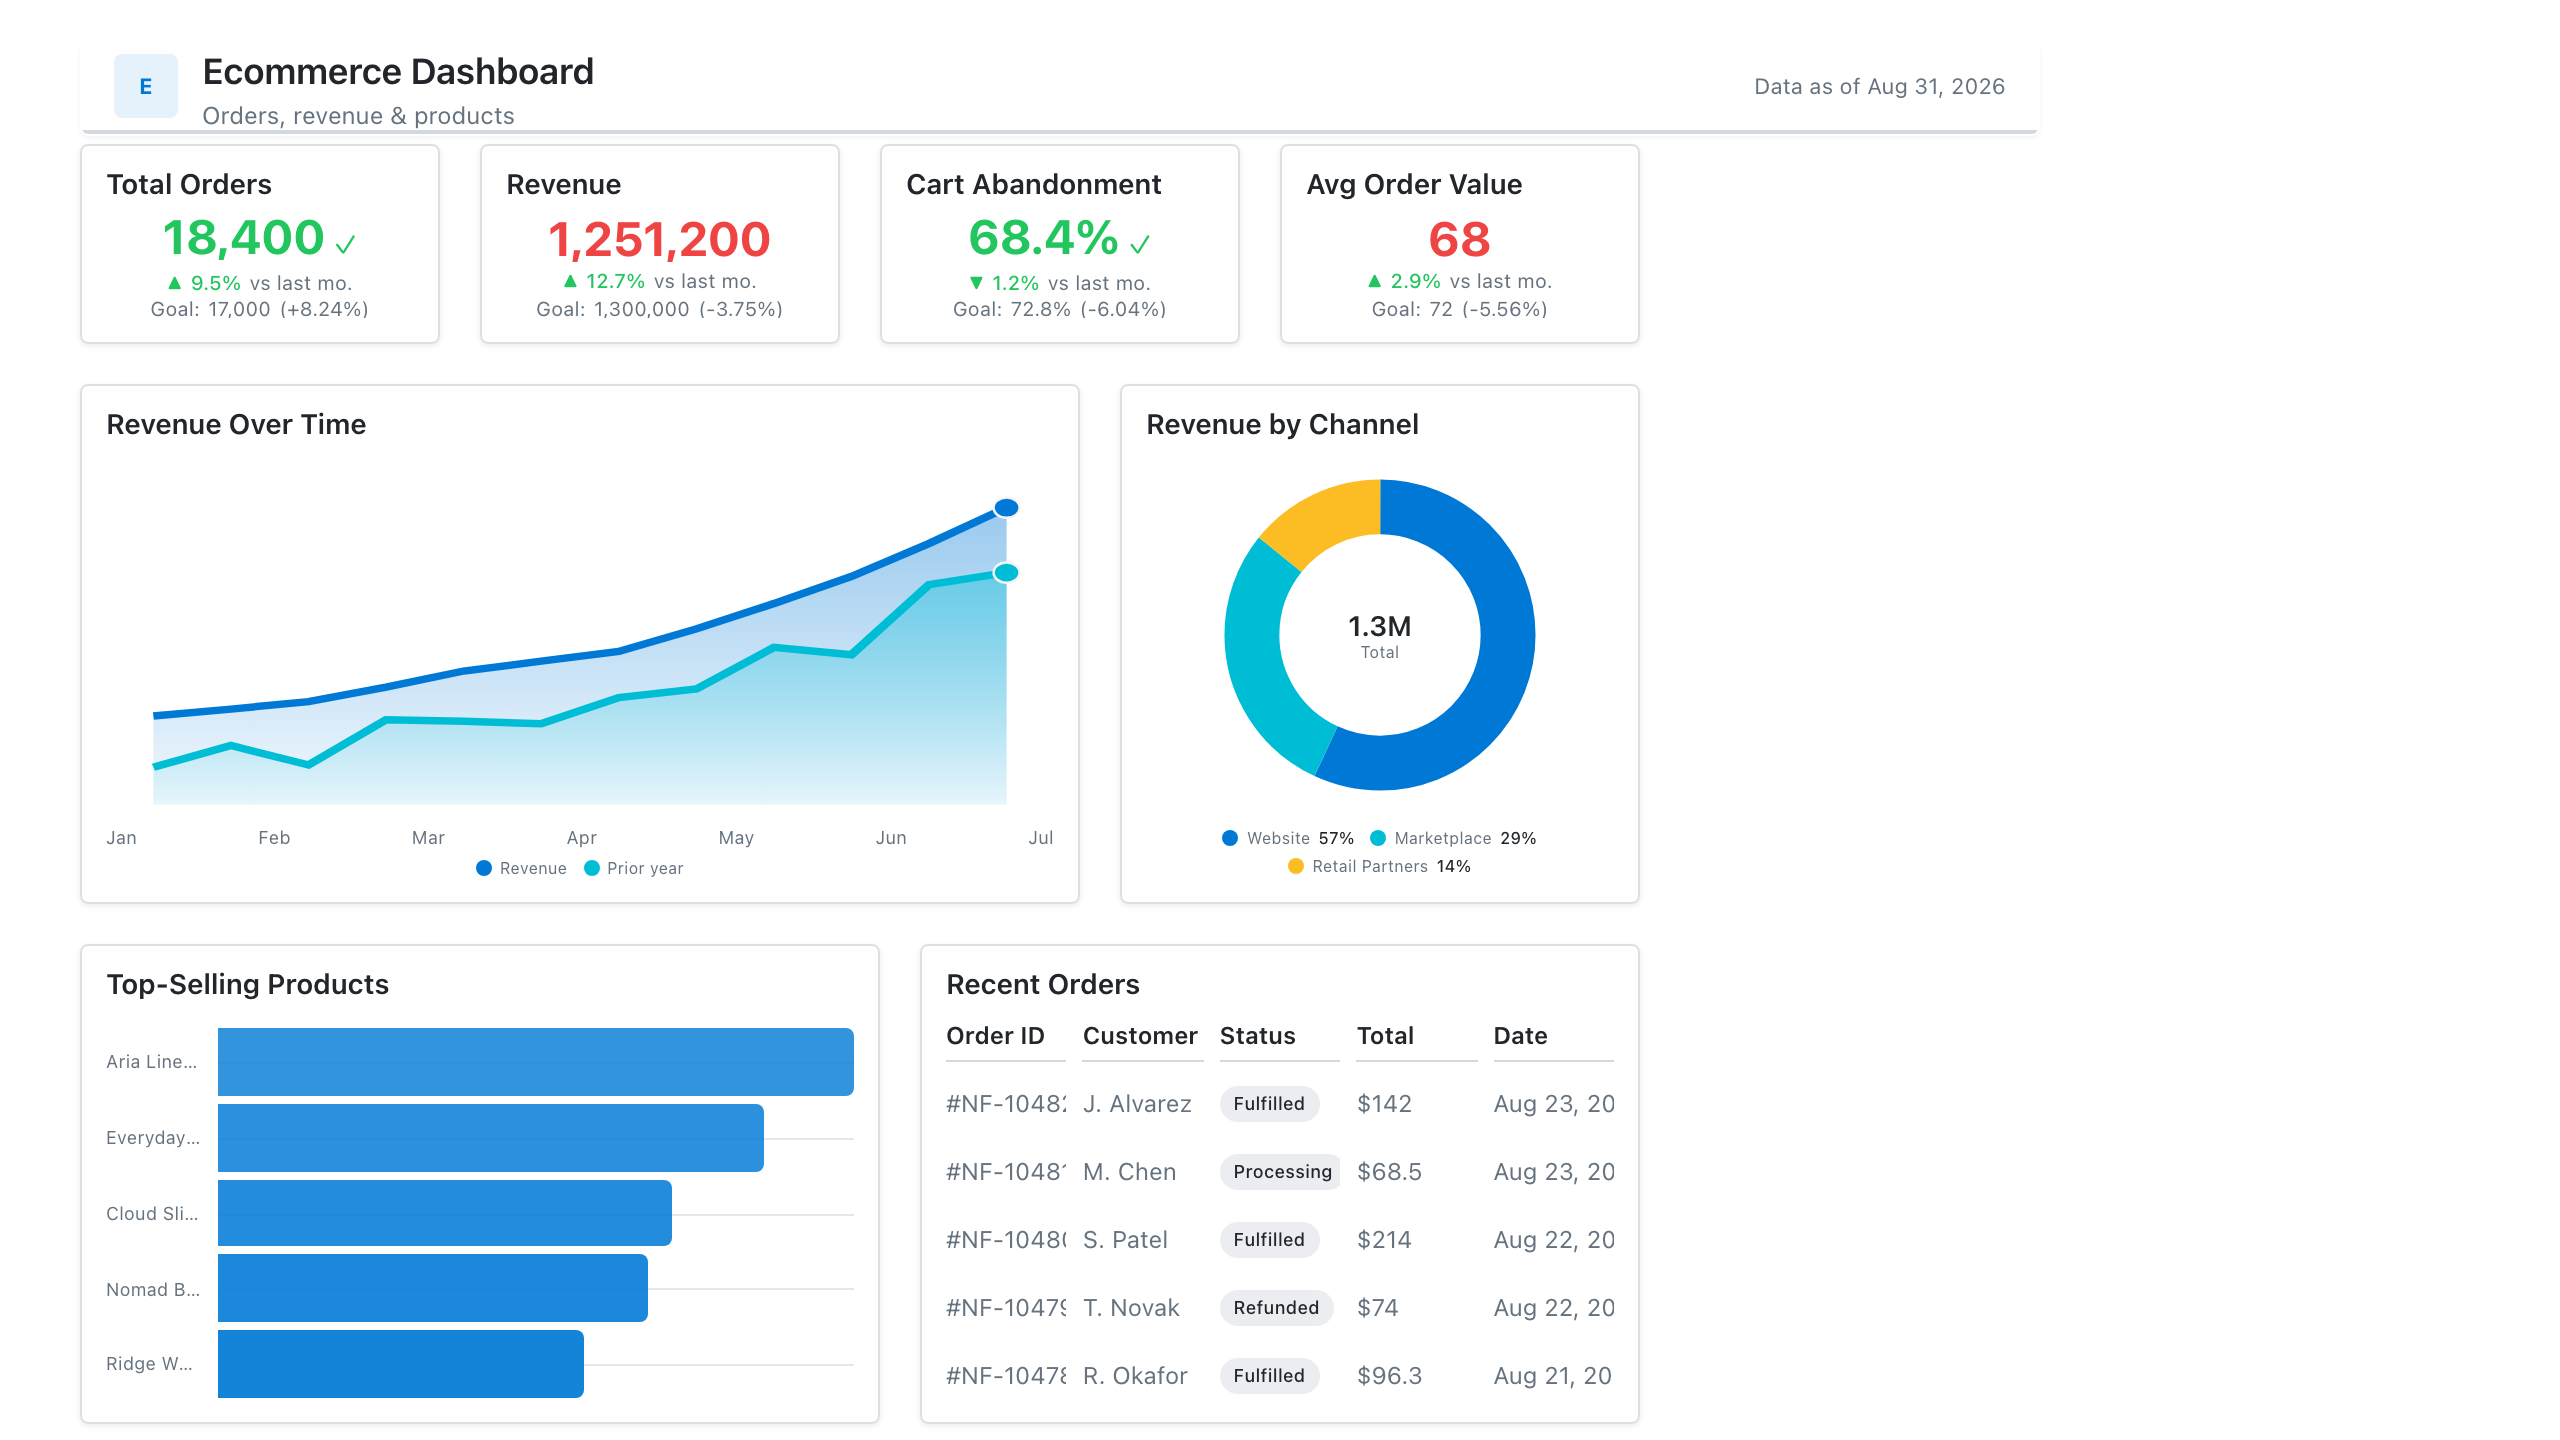
Click the mockup to open it full size
About this template
EcommerceA store-performance layout: revenue and order KPIs, revenue-by-channel area chart, cart-abandonment rate, and a top-products table. A common client-facing mockup for agencies pitching a retail analytics build.
Metrics this dashboard tracks
- Revenue & orders
- Average order value
- Conversion rate
- Cart abandonment
- Revenue by channel
- Top-selling products
What's on the Ecommerce dashboard?
| Section | What it shows | Why it's here |
|---|---|---|
| Header and filters Title card, date range picker, two dropdown filters | The title ("Ecommerce Store Performance Dashboard"), a subtitle, a data last updated timestamp and three filters: a date range set to the last 12 months and two dropdowns set to All. | Sets the time window and any segment before the numbers are read, and the timestamp shows how current the store data is. |
| KPI row Five KPI cards | Revenue, orders, average order value, conversion rate and cart abandonment rate, each with the previous month value and the change. | Shows the month-on-month health of the store in one row, including whether higher revenue came from more orders, bigger baskets or better conversion. |
| Channel and funnel row Multi-line chart, funnel chart | Monthly revenue over twelve months for five channels (paid search, organic search, email marketing, social media, direct), beside a funnel from sessions through product views, added to cart, checkout started, payment entered and orders completed, with counts and stage-to-stage percentages. | The lines show which channels are growing, and the funnel shows at which step shoppers leave, so the reader can decide whether to invest in traffic or fix the checkout. |
| Product row Table with data bars and a total row | Top-selling products with product name, category, units sold, revenue and conversion rate, with the rate shown as a bar, and a total row for units and revenue. | Names the products behind the revenue, so merchandising and promotion decisions can be made for specific items. |
What each metric means
Revenue
- Definition: The total value of orders in the period. Companies differ on whether to include tax, shipping and discounts and whether to net out refunds, so state your definition.
- Formula:
Revenue = sum of order value in the period - Why it matters: It is the headline result of the store and the figure other metrics are compared with.
- Why a KPI card: A large figure with the previous month and a percentage change gives the result and direction at a glance.
Orders
- Definition: The number of completed orders in the period.
- Formula:
Orders = count of completed orders - Why it matters: Together with average order value it explains revenue, showing whether growth comes from volume or basket size.
- Why a KPI card: A single count with a change versus the previous month suits a volume figure read next to revenue.
Average order value
- Definition: The average amount spent per order in the period.
- Formula:
Average order value = revenue / orders - Why it matters: It shows whether shoppers are buying more per order, which pricing, bundles and free-shipping thresholds can change.
- Why a KPI card: One currency figure with a change versus the previous month is enough for a ratio that moves slowly.
Conversion rate
- Definition: The share of sessions that end in an order. Some teams use visitors or users instead of sessions, so label the denominator.
- Formula:
Conversion rate = orders / sessions - Why it matters: It shows how well the store turns traffic into sales, independent of how much traffic arrives.
- Why a KPI card: A percentage with a change versus the previous month suits a rate watched for small movements.
Cart abandonment rate
- Definition: The share of shopping carts that do not end in a completed order. Definitions vary, for example whether carts are counted when an item is added or when checkout starts.
- Formula:
Cart abandonment rate = 1 - (completed orders / carts created) - Why it matters: It shows how much intended revenue is lost between adding to cart and paying, which is often addressed with checkout fixes or reminder emails.
- Why a KPI card: A percentage beside conversion rate lets the reader see both ends of the same behaviour, and a fall here reads as an improvement.
Revenue by channel over time
- Definition: Monthly revenue attributed to each acquisition channel, such as paid search, organic search, email, social media and direct. Attribution rules vary between analytics tools.
- Formula:
Channel revenue = sum of order value attributed to the channel in the month - Why it matters: It shows which channels grow and which are flat, so marketing spend and effort can be redirected.
- Why a line chart: One line per channel across twelve months shows each trend and lets the lines be compared, which a table of numbers would not.
Cart and checkout drop-off
- Definition: The count of sessions at each step from session to completed order, with the percentage that continues to the next step. Steps depend on how the store tracks events.
- Formula:
Step conversion = count at step / count at previous step - Why it matters: It shows which step loses the most shoppers, so fixes target that step.
- Why a funnel chart: Narrowing bars show the loss at each step in order, and the percentages beside them show which step loses most.
Top-selling products
- Definition: The products with the most sales in the period, with category, units sold, revenue and the product-level conversion rate (orders containing the product divided by views of it, in most tools).
- Formula:
Product conversion rate = orders of the product / product page sessions - Why it matters: It shows which products carry revenue and which convert best, so stock, ads and merchandising can focus on them.
- Why a table: A table keeps product names and exact values together, and data bars in the conversion column make the best converters visible.
Data you need to build this
- Ecommerce platform (Shopify, WooCommerce, Magento or similar), orders Order ID, Order date, Order status, Order total, Discounts, Refunds, Customer ID, Line items (product ID, quantity, price)
- Web analytics (GA4, Adobe Analytics or similar) Date, Sessions, Source or channel, Product views, Add to cart events, Begin checkout events, Add payment info events, Purchase events
- Product catalogue Product ID, Product name, Category
- Channel mapping table Source or medium, Channel group (paid search, organic search, email, social, direct)
Why it's laid out this way
- The five KPI cards are ordered so revenue is followed by the two things that explain it, orders and average order value, and then by the two rates, conversion and cart abandonment, that describe how shoppers behave.
- The channel lines and the funnel share a row, with the wider space given to twelve months of five lines. One side answers where revenue comes from, the other where shoppers leave, which are the two levers a store can pull.
- The product table is last and full width because it has the most columns and is the most detailed view, read once the reader knows which channel or step they care about.
Last updated:
More like this
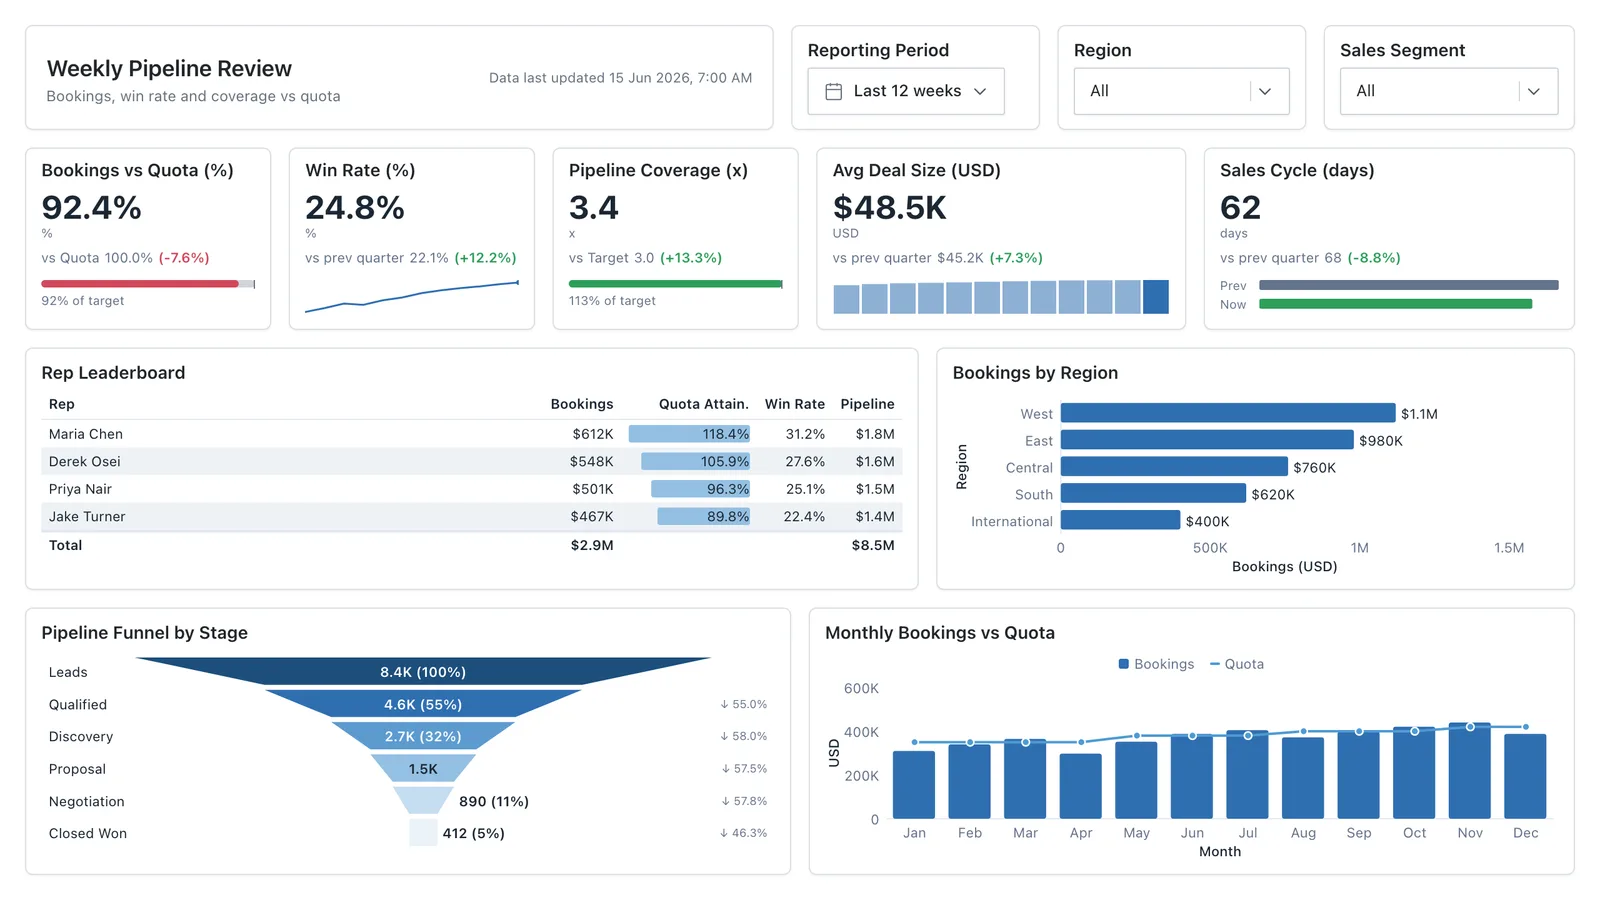
Sales Performance
Revenue, win rate, pipeline value, and rep performance across regions — the layout most sales teams build first.
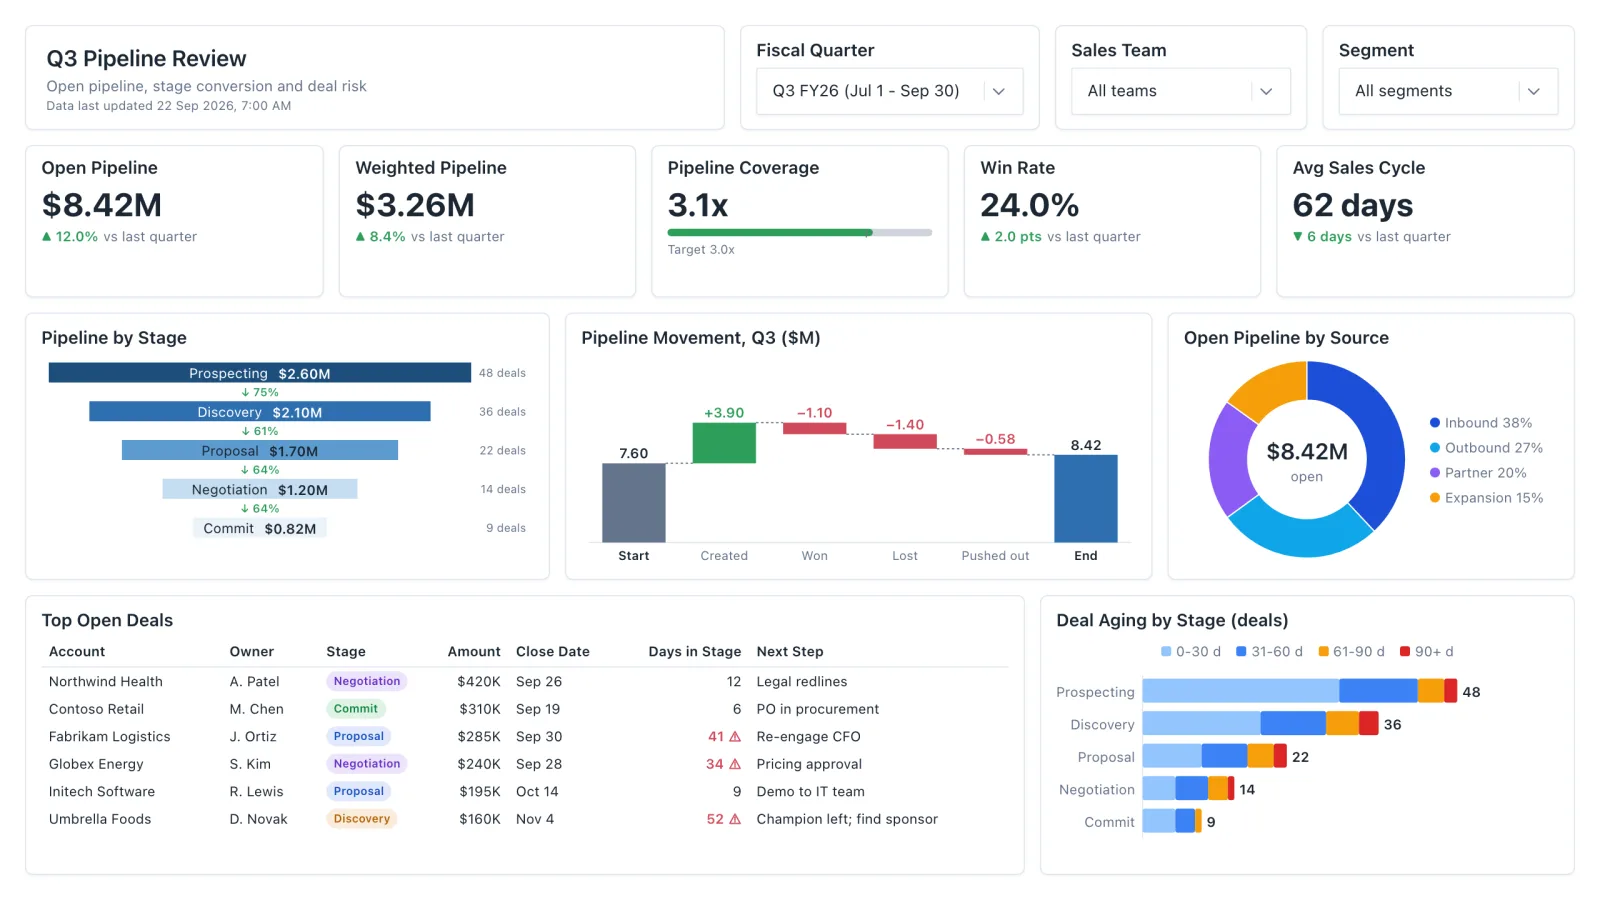
Sales Pipeline
Sales pipeline dashboard with open and weighted pipeline, coverage vs target, a stage funnel and stale-deal flags.
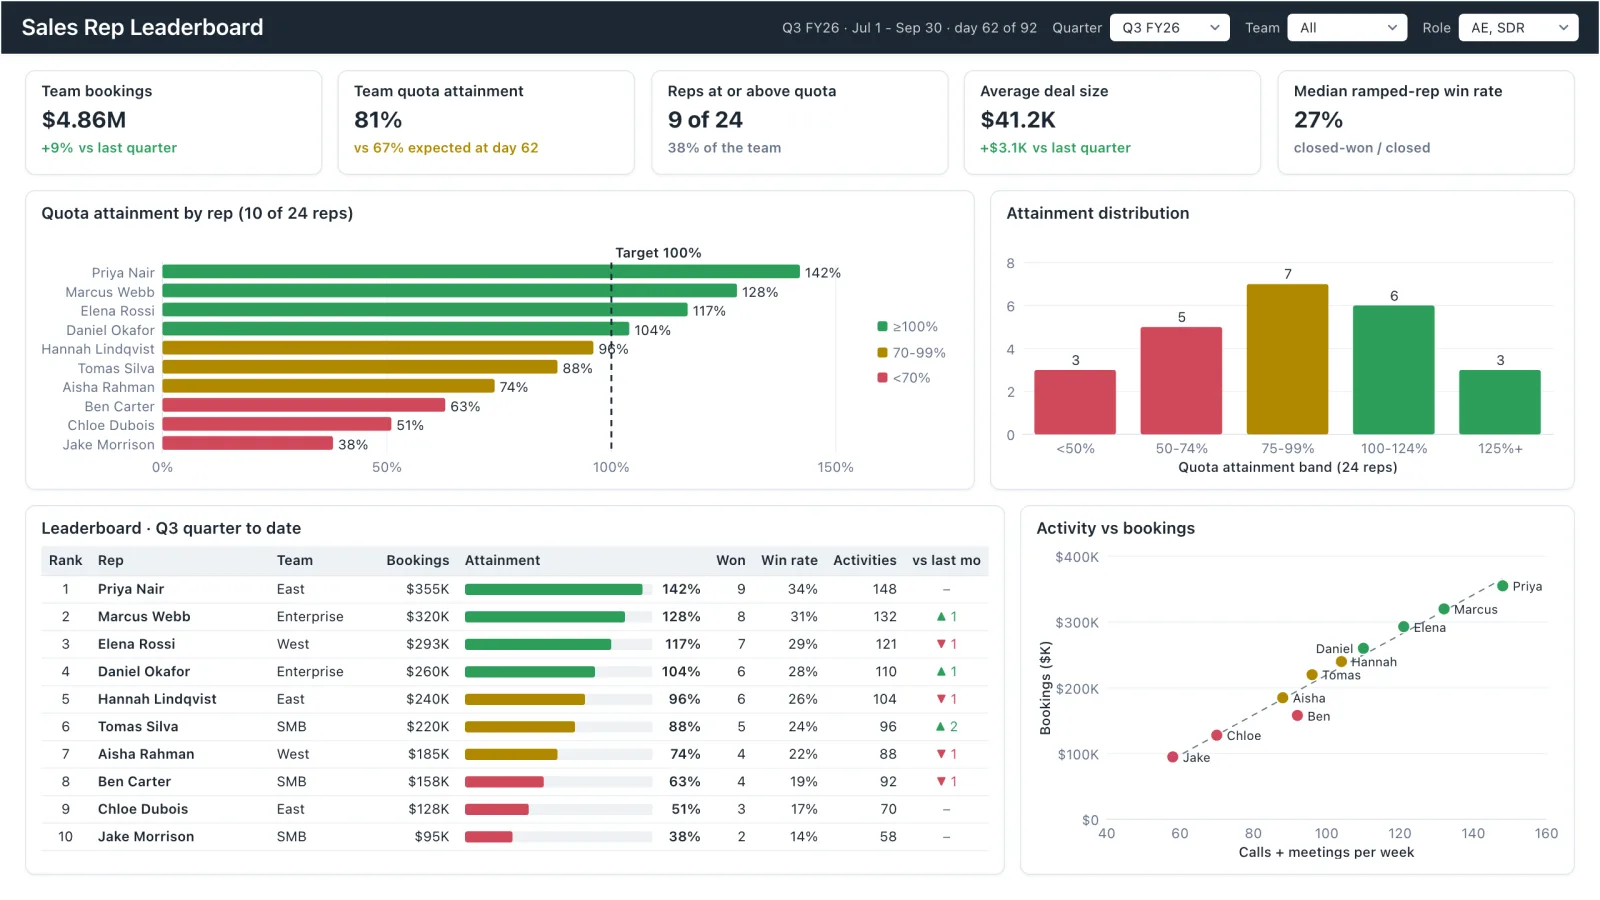
Sales Rep Leaderboard
Sales rep dashboard example with quota attainment by rep, a ranked leaderboard table and activity vs bookings.
Marketing Analytics
Campaign spend, traffic sources, conversion funnel, and lead volume in one wireframe.
Sales, finance, HR, SaaS, and more — filter by team or search by metric.