Marketing Analytics Dashboard Mockup Template
The Marketing Analytics dashboard template is a one-page layout for marketing leaders and demand generation analysts, built to decide which channels and campaigns turn spend into qualified pipeline at an acceptable cost. It shows marketing spend, leads, MQLs, cost per lead, MQL-to-SQL rate, a visit-to-opportunity funnel, campaign performance, leads by channel and spend mix.
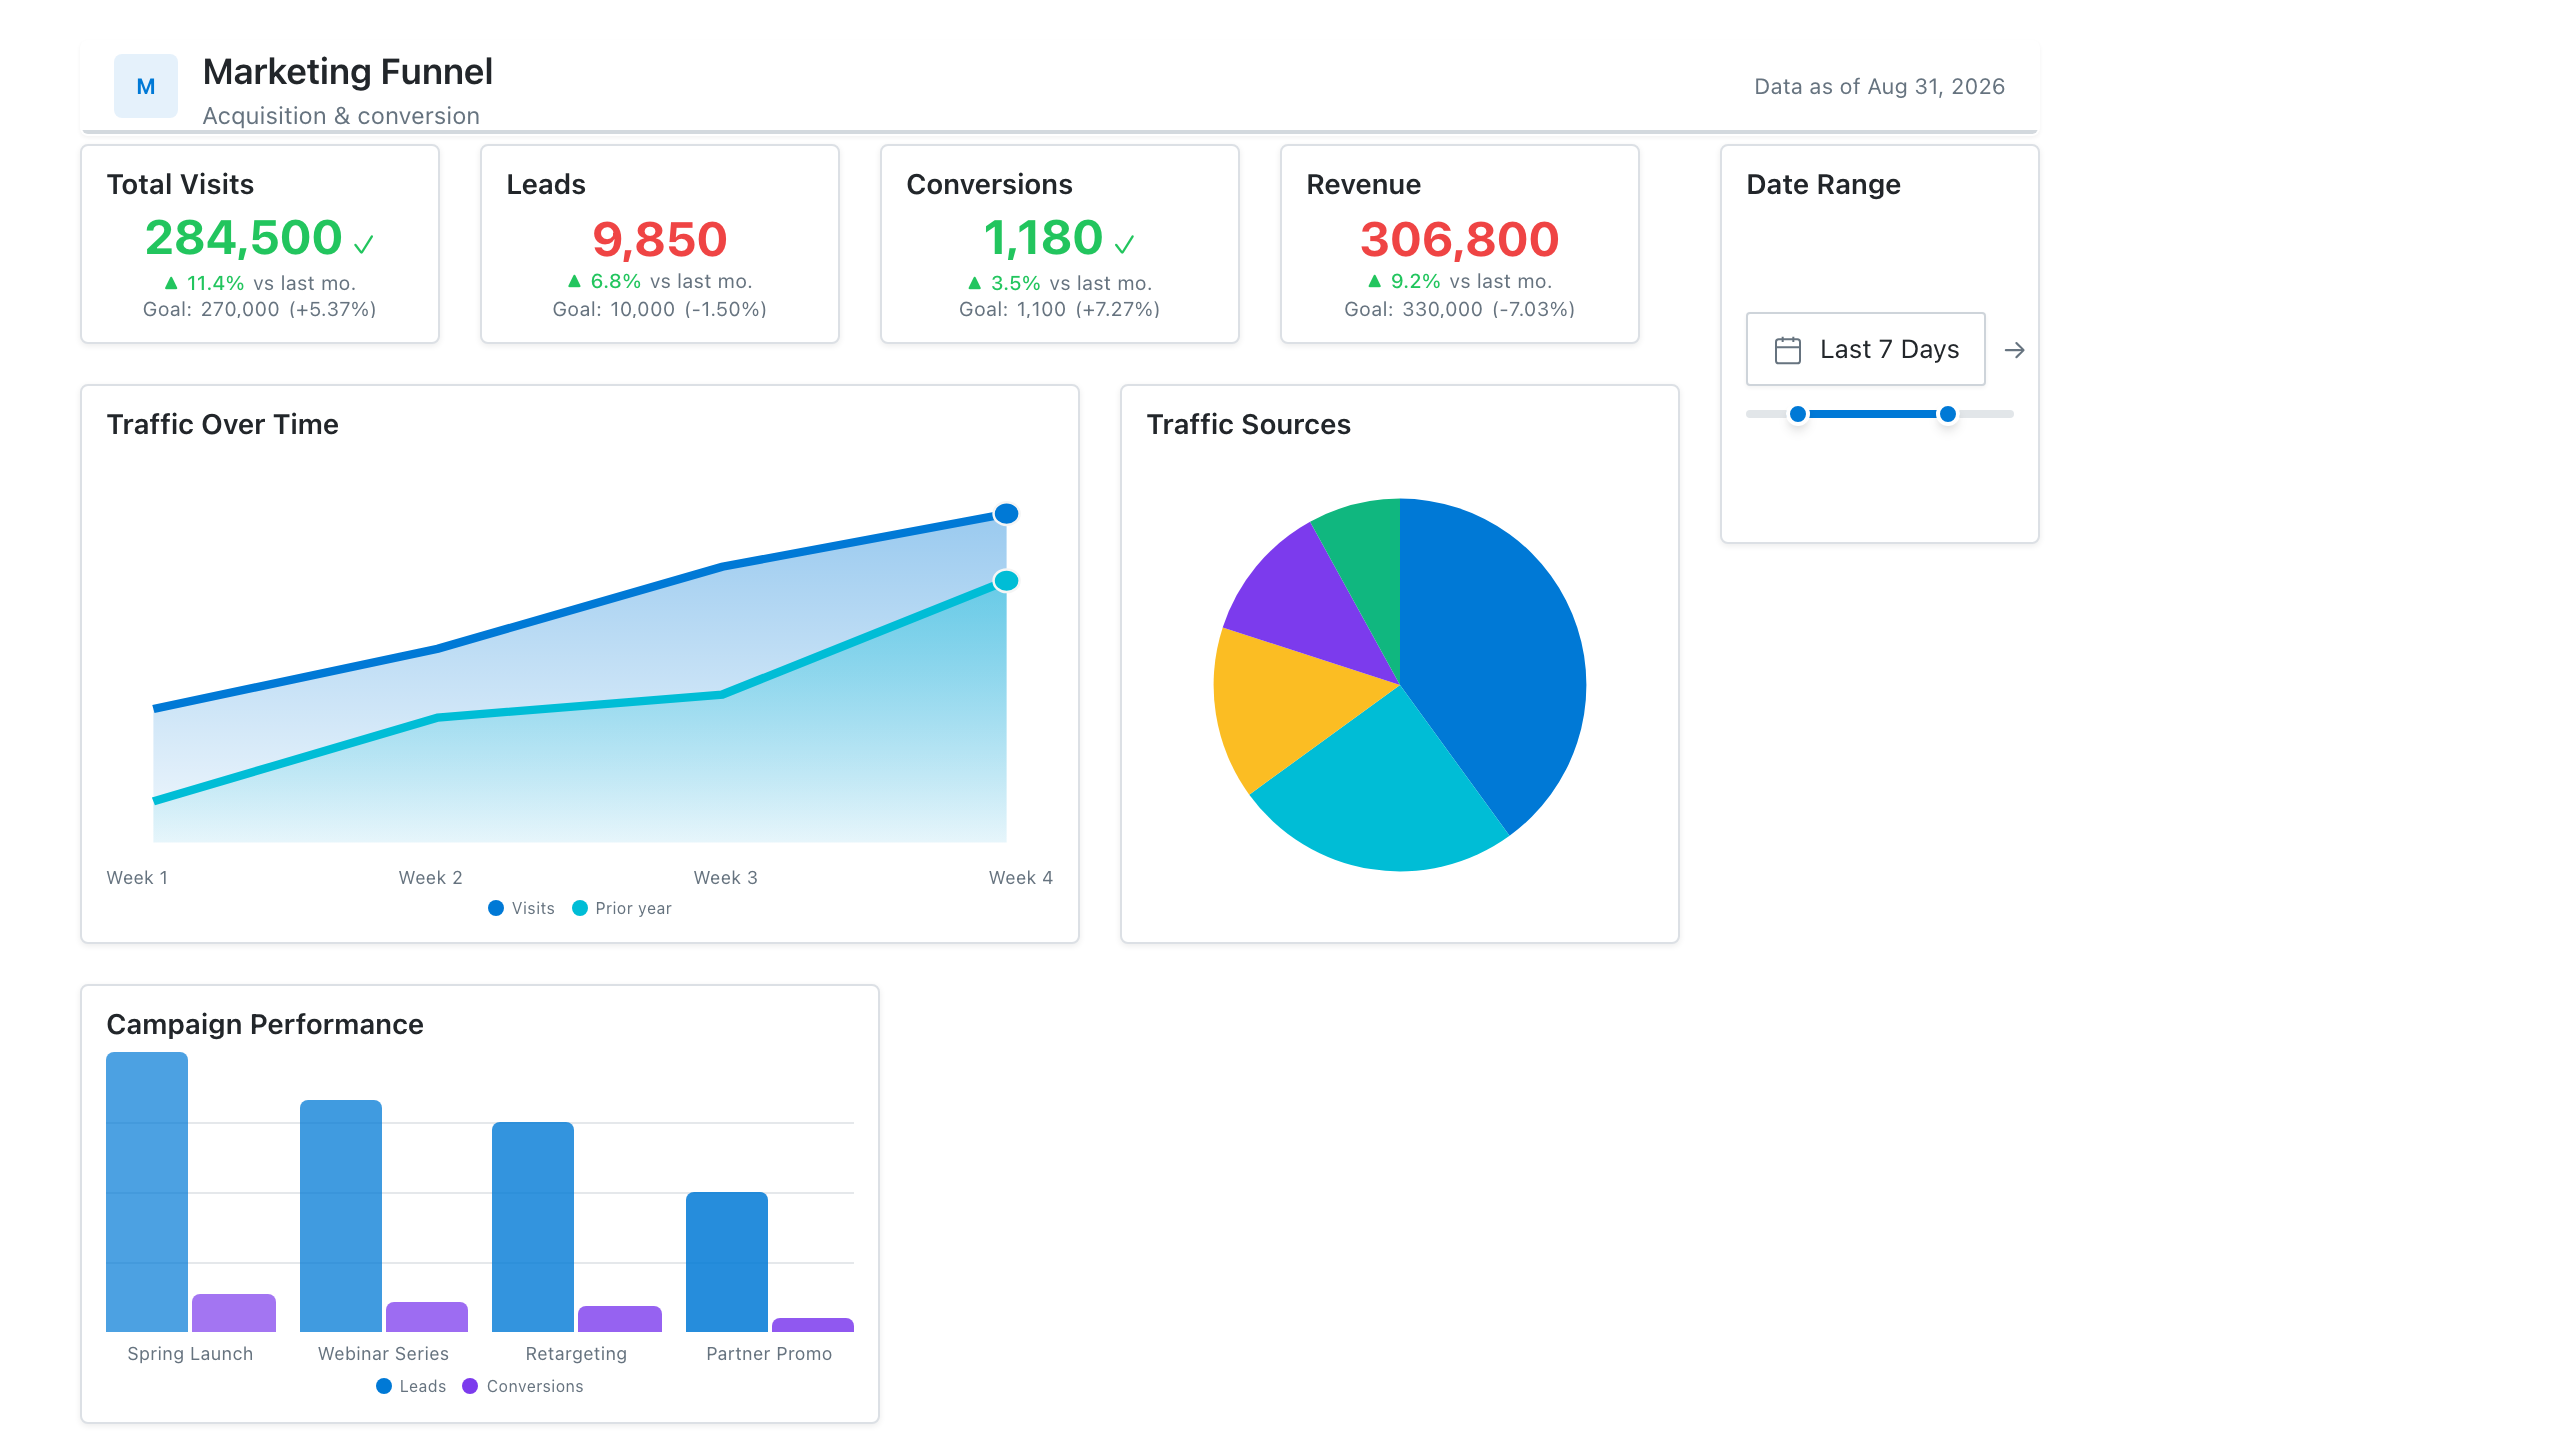
Click the mockup to open it full size
About this template
MarketingSpend, traffic, and conversion in one place: a top-of-funnel-to-MQL funnel visual, channel mix as a donut, and a lead-volume trend. Built for the monthly marketing review where you need to connect budget to pipeline without opening five tools.
Metrics this dashboard tracks
- Marketing spend & CAC
- Sessions by channel
- Conversion funnel (visit → lead → MQL)
- Lead volume trend
- Cost per lead
- Campaign performance
What's on the Marketing Analytics dashboard?
| Section | What it shows | Why it's here |
|---|---|---|
| Header and filters Title card, three dropdown filters | The report title ("B2B Funnel & Spend Dashboard"), the subtitle "Pipeline conversion, spend and channel mix", a data last updated timestamp, and filters for reporting period, marketing channel and industry segment. | Lets one page serve every channel and segment, so the reader confirms the period and scope before trusting any number. |
| KPI row Five KPI cards with comparison bars, a sparkline, mini columns and a progress bar | Marketing spend ($1.92M), total leads (18,400), MQLs (7,360), cost per lead ($104.35) and MQL-to-SQL rate (35.0% against a 40.0% target), each compared with the previous quarter or the target. | Puts cost and volume side by side, so the reader sees whether spend rose faster than leads and whether lead quality held before reading any chart. |
| Funnel and campaign row Funnel chart, table | A visit-to-opportunity funnel (website visits, leads, MQLs, SQLs, opportunities) with counts, share of visits and step-to-step conversion, beside a campaign table of channel, spend, leads and cost per lead (shaded) for five campaigns with a total. | Shows where prospects drop out of the funnel and which named campaigns produce leads cheaply, so the reader can decide what to scale or cut. |
| Channel trend and spend mix row Stacked area chart, donut chart | Leads per month by channel (paid search, content marketing, email marketing, social media, referral) over 12 months, beside a donut of spend share by channel with a $710K total in the centre. | Lets the reader compare where leads come from with where money goes, so a channel that takes a large share of spend but a small share of leads stands out. |
What each metric means
Marketing spend
- Definition: Total money spent on marketing programs in the period. Companies differ on whether it includes salaries, tools and agency fees or only media and program costs, so state what is included.
- Formula:
Marketing spend = sum of program, media and other included costs in the period - Why it matters: It is the cost side of every efficiency measure on the page.
- Why a KPI card with comparison bars: Bars for the previous and current quarter show the change in spend at a glance next to the headline figure.
Total leads
- Definition: The number of new contacts captured in the period who have shown interest, for example through a form, a content download or an event. What counts as a lead is set by each company.
- Formula:
Total leads = count of new lead records created in the period - Why it matters: It measures the volume of demand marketing is creating at the top of the funnel.
- Why a KPI card with sparkline: The sparkline shows the direction of lead volume over recent periods without needing a separate chart.
MQLs (marketing qualified leads)
- Definition: Leads that meet the marketing team's qualification rules, usually a fit and engagement score, and are ready to pass to sales. The rules vary by company.
- Formula:
MQLs = count of leads that reached the MQL status in the period - Why it matters: It shows how many leads are good enough to hand to sales, not only how many were captured.
- Why a KPI card with mini column chart: Small columns for recent periods show the trend next to the current count, with the latest period highlighted.
Cost per lead
- Definition: The average marketing spend needed to generate one lead in the period. Because spend scope varies by company, compare it only against figures calculated the same way.
- Formula:
Cost per lead = marketing spend / total leads - Why it matters: It shows how efficiently spend turns into leads, and whether efficiency is improving.
- Why a KPI card with comparison bars: Previous and current bars make the change in cost visible, and for this metric a shorter bar is the better result.
MQL-to-SQL rate
- Definition: The share of MQLs that sales accepts as sales qualified leads (SQLs) in the period. Timing matters, because MQLs and the SQLs they become may fall in different periods.
- Formula:
MQL-to-SQL rate = SQLs / MQLs x 100 - Why it matters: It shows whether the leads marketing passes over are the ones sales will work.
- Why a KPI card with progress bar: The bar against the 40.0% target shows how close the rate is to goal, which the percentage alone does not.
Visit-to-opportunity funnel
- Definition: The number of people or records that reach each stage from website visit to lead, MQL, SQL and opportunity, with the percentage that moves from one stage to the next.
- Formula:
Stage conversion = records reaching the next stage / records that entered the stage - Why it matters: It shows which step loses the most prospects, so effort goes to the right stage.
- Why a funnel chart: Narrowing bars make the drop between stages visible, with step percentages beside them to mark the weakest step.
Campaign performance
- Definition: Spend, leads and cost per lead for each campaign, with its channel, plus a total. Cost per lead is shaded so the most and least efficient campaigns stand out.
- Formula:
Campaign cost per lead = campaign spend / campaign leads - Why it matters: It shows which specific campaigns deserve more budget and which should be changed or stopped.
- Why a table: A table keeps exact spend and lead counts for named campaigns in one row, and shading on cost per lead guides the eye.
Leads by channel over time
- Definition: Monthly lead counts split by marketing channel and stacked, so the height of the stack is total leads and each band is one channel.
- Formula:
Channel leads = count of leads in the month where channel = the channel - Why it matters: It shows whether growth in leads comes from one channel or several, and whether the mix is shifting.
- Why a stacked area chart: Stacked areas show both the total over 12 months and each channel's contribution to it.
Spend mix by channel
- Definition: The share of total marketing spend going to each channel in the period.
- Formula:
Channel share = channel spend / total spend - Why it matters: It shows where the budget goes, to compare with the channel lead trend beside it.
- Why a donut chart: Slices show each channel's share of one total, and the total spend fits in the centre.
Data you need to build this
- Marketing automation or CRM (HubSpot, Marketo, Salesforce or similar), lead and contact records Lead ID, Created date, Lead source or channel, Campaign, Industry, MQL date, SQL date, Opportunity created date, Lifecycle stage
- Web analytics (Google Analytics or similar) Date, Sessions or visitors, Channel grouping, Campaign
- Ad platforms and finance or budget sheet Date, Channel, Campaign, Spend, Program cost category
- Targets sheet Metric, Period, Target (for example MQL-to-SQL rate)
Why it's laid out this way
- The five KPI cards sit directly under the filters and pair cost with volume, with spend, leads, MQLs and cost per lead before the quality measure, MQL-to-SQL rate, which carries the only target bar.
- The funnel and the campaign table share the second row. The funnel shows where prospects drop out, and the table shows which campaigns produced the leads and at what cost per lead, with that column shaded.
- The bottom row sets the lead trend by channel beside the donut of spend share by channel, so the reader can compare how much each channel contributes with how much it costs.
Last updated:
More like this
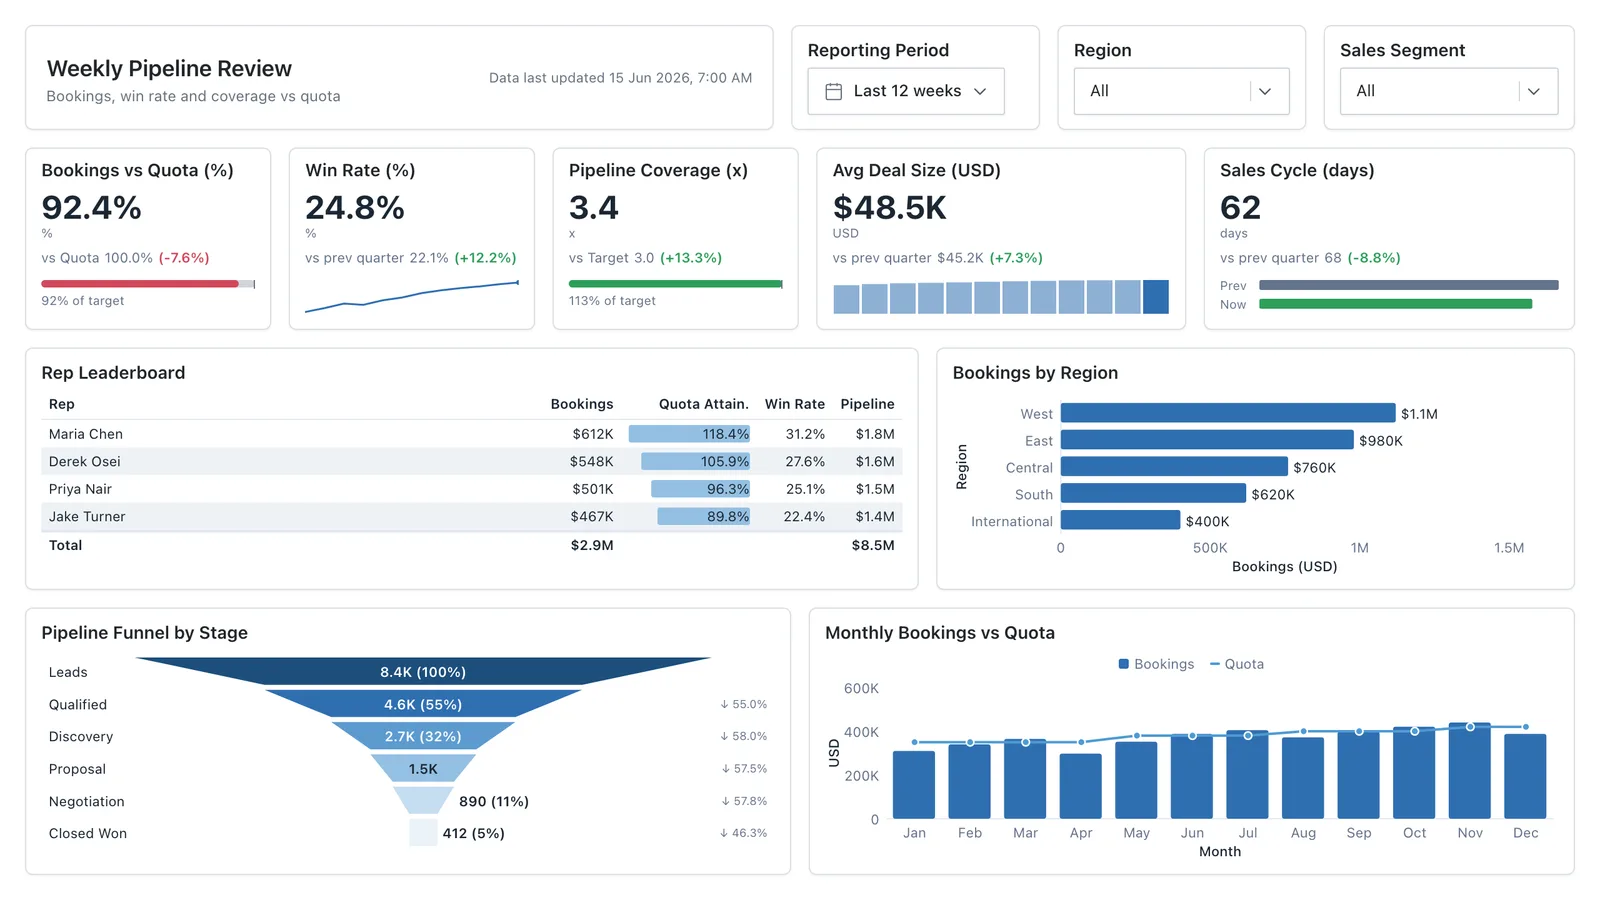
Sales Performance
Revenue, win rate, pipeline value, and rep performance across regions — the layout most sales teams build first.
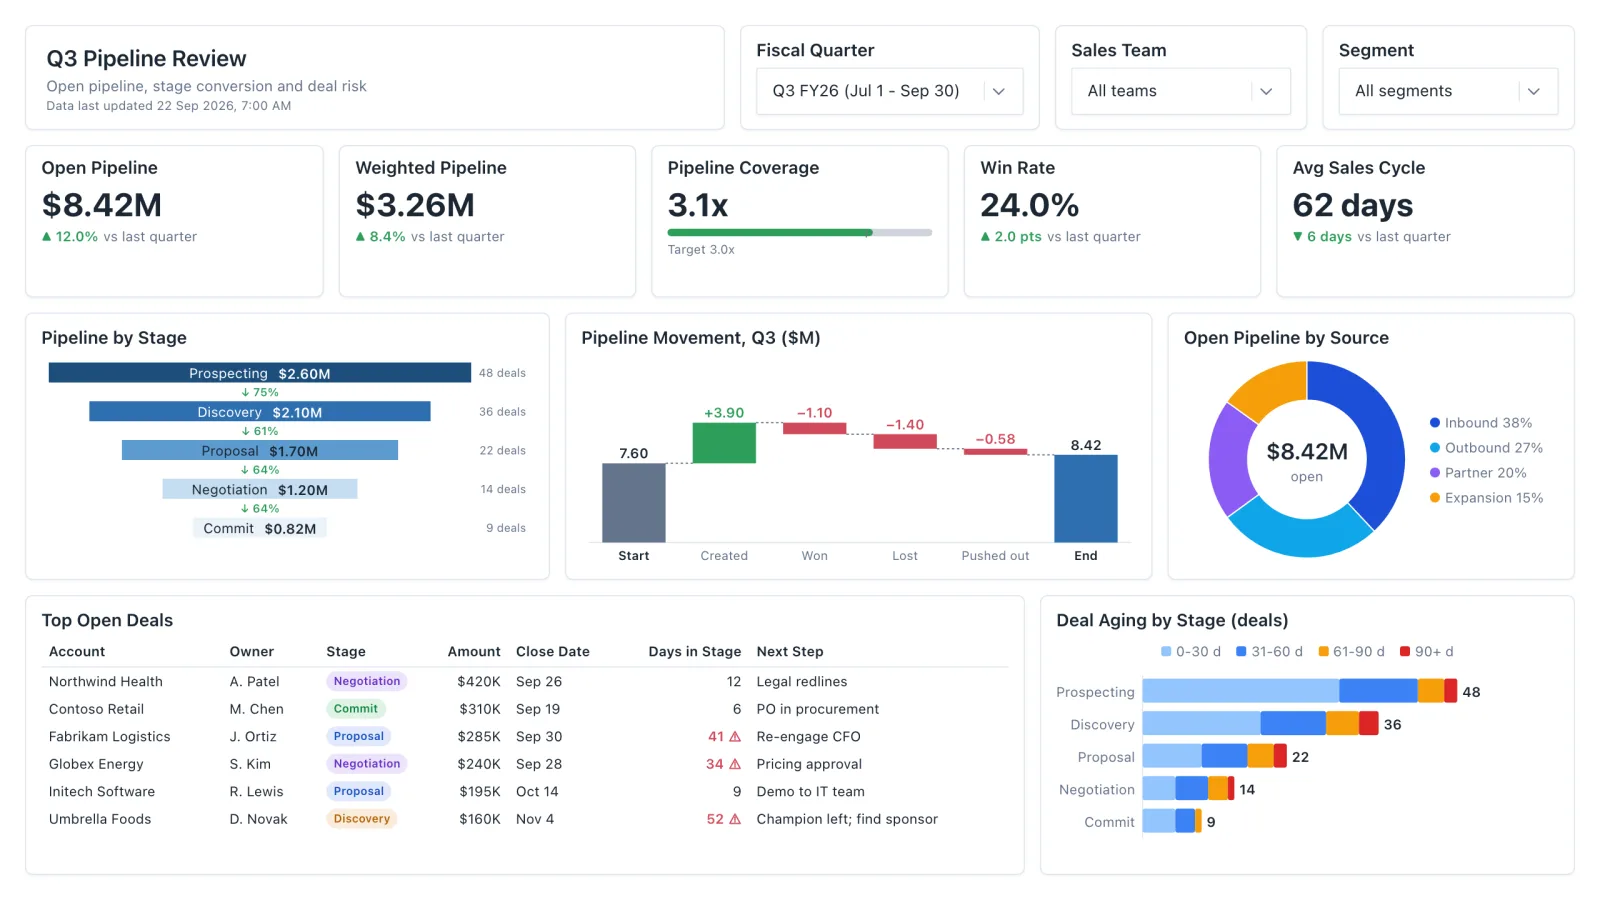
Sales Pipeline
Sales pipeline dashboard with open and weighted pipeline, coverage vs target, a stage funnel and stale-deal flags.
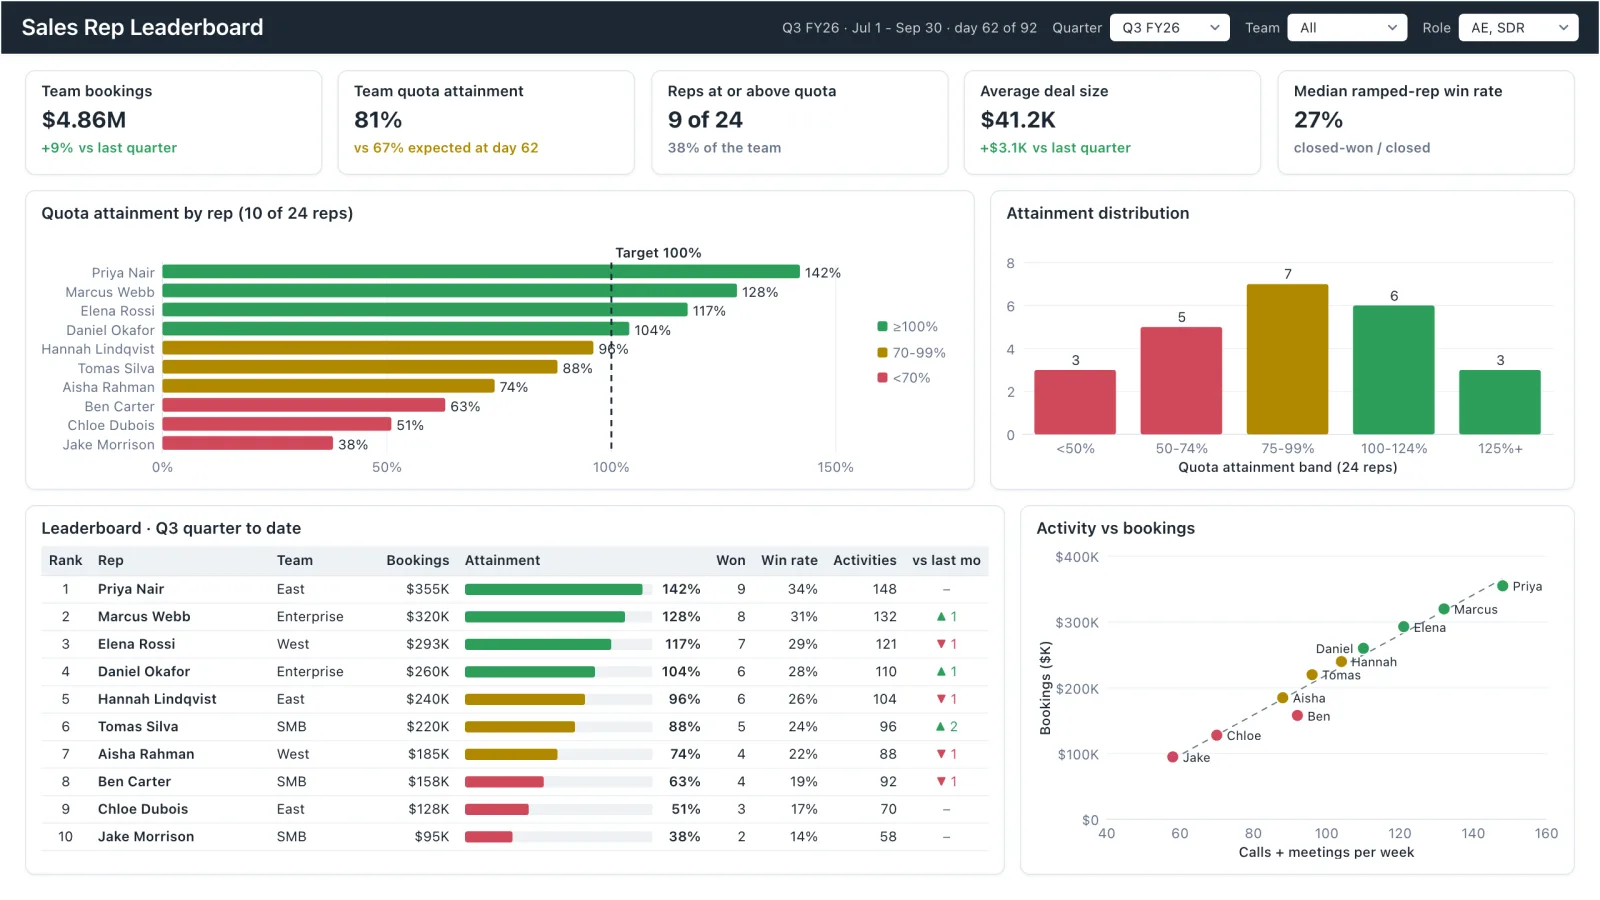
Sales Rep Leaderboard
Sales rep dashboard example with quota attainment by rep, a ranked leaderboard table and activity vs bookings.
Executive KPI Overview
Single-page executive view of the metrics leadership cares about — built for the first client meeting.
Sales, finance, HR, SaaS, and more — filter by team or search by metric.