Sales Pipeline Dashboard Mockup Template
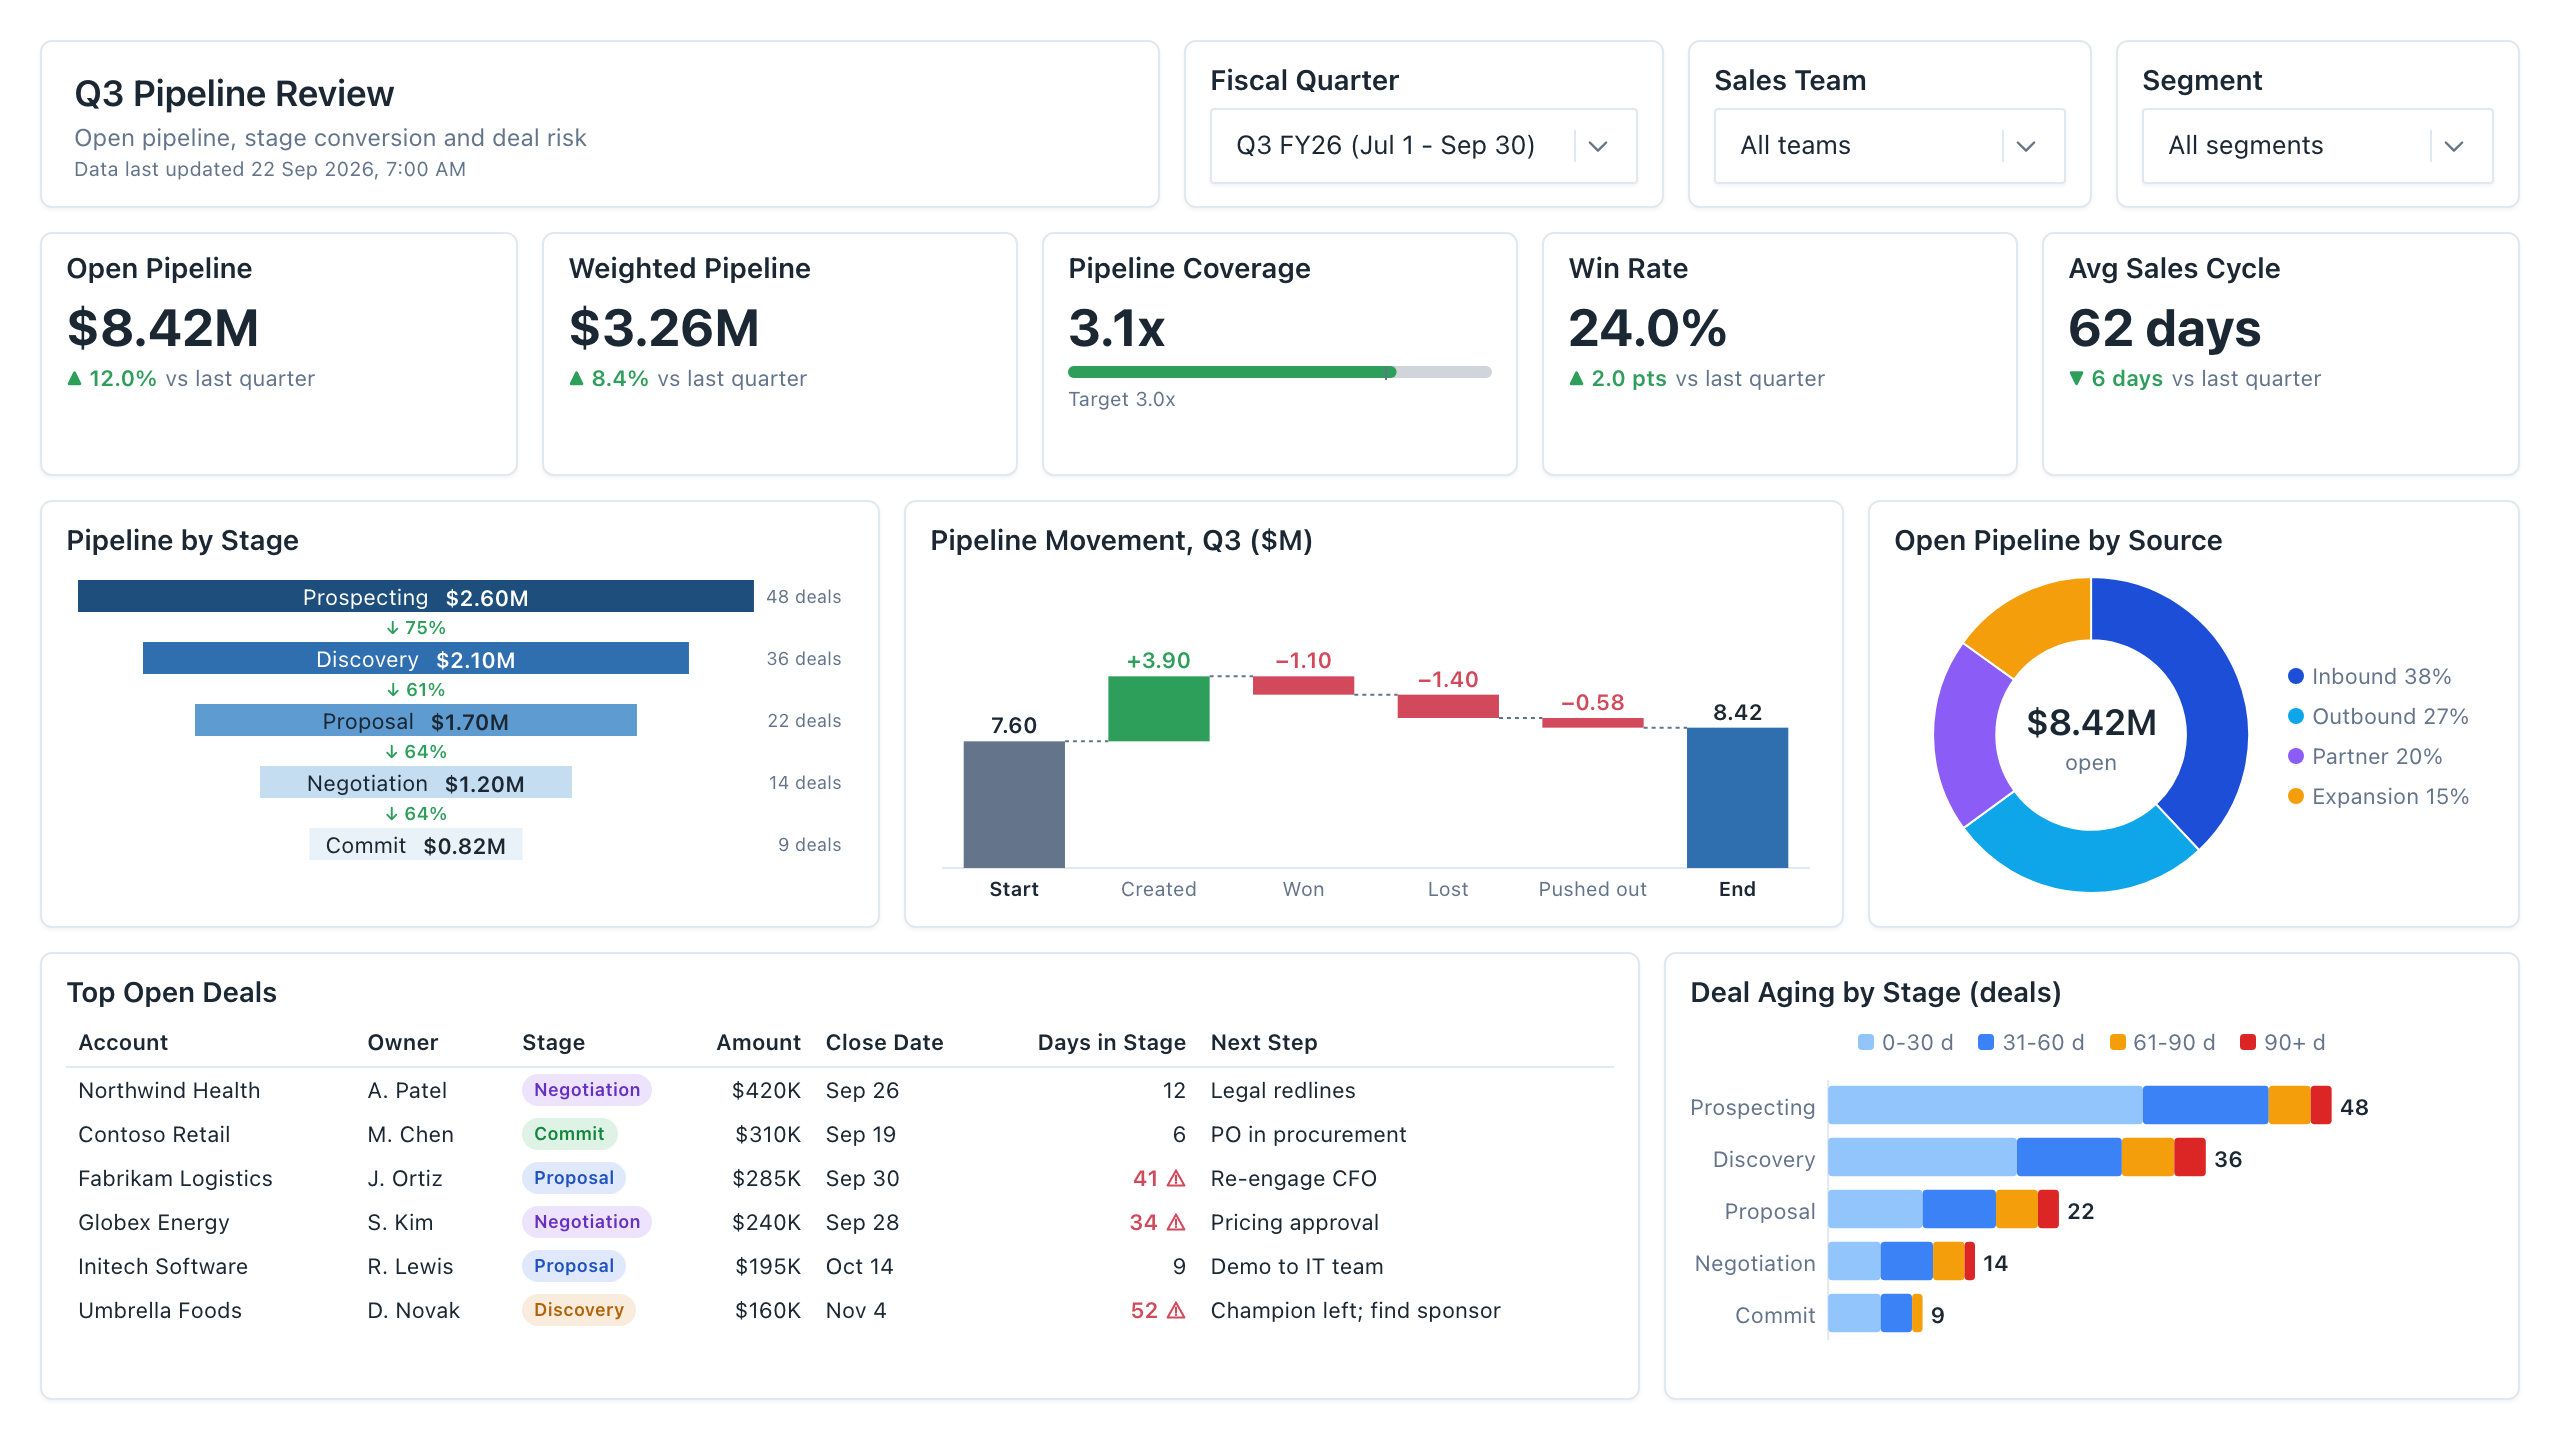
The Sales Pipeline dashboard template is a one-page weekly review layout for VPs of Sales and RevOps leads, built to decide whether open pipeline covers the quarter's target and which deals need attention before the next forecast call. It shows open pipeline, weighted pipeline and pipeline coverage against target.
Click the mockup to open it full size
About this template
SalesA sales pipeline dashboard for the weekly pipeline call, where a VP of Sales or RevOps lead checks whether open pipeline covers the quarter and which deals are stuck. Five KPIs (open pipeline, weighted pipeline, coverage, win rate, sales cycle) sit above a stage funnel with value and deal count, a pipeline movement waterfall, a source donut, a top open deals table and a stacked deal-aging bar. Deals idle for more than 30 days in a stage are flagged in red, so the table doubles as the call agenda.
Metrics this dashboard tracks
- Open pipeline
- Weighted pipeline
- Pipeline coverage vs. target
- Win rate
- Average sales cycle
- Pipeline by stage & conversion
- Pipeline movement (created, won, lost, pushed)
- Deal aging by stage
What's on the Sales Pipeline dashboard?
| Section | What it shows | Why it's here |
|---|---|---|
| Header and filters Title card, three dropdown filters | The report title ("Q3 Pipeline Review"), a subtitle, a data last updated timestamp, and filters for fiscal quarter, sales team and segment. | Lets one page serve every team and quarter, so the reader confirms the scope and data freshness before trusting any number. |
| KPI row Five KPI cards, one with a progress bar | Open pipeline, weighted pipeline, pipeline coverage (with a bar against a 3.0x target), win rate and average sales cycle, each with a change versus last quarter. | Answers whether the quarter is covered before anyone reads a chart, so the call starts with the decision rather than the data. |
| Stage, movement and source row Funnel chart, waterfall chart, donut chart | Pipeline value and deal count by stage with conversion percentages between stages; a waterfall from starting to ending pipeline (created, won, lost, pushed out); and open pipeline split by source (inbound, outbound, partner, expansion). | Puts where value sits, how it moved and where it came from side by side, so the reader can tell which stage, change or channel explains the total. |
| Deal detail row Table, stacked bar chart | A table of top open deals (account, owner, stage, amount, close date, days in stage, next step) with stale deals flagged in red, beside a stacked bar of deal counts by stage split into 0-30, 31-60, 61-90 and 90+ day age buckets. | Turns the review into an agenda: the reader sees which named deals are stale and which stages hold the oldest deals, then assigns next steps. |
What each metric means
Open pipeline
- Definition: The total amount of all deals that are still open (not won or lost), usually limited to deals expected to close in the selected period. Some teams include every open deal regardless of close date, so state which one you use.
- Formula:
Open pipeline = sum of amount for open deals in the period - Why it matters: It is the raw material for the quarter and the numerator of coverage.
- Why a KPI card: A single large number with a change indicator gives the headline total at a glance, which a chart would bury.
Weighted pipeline
- Definition: Open pipeline with each deal discounted by the probability attached to its stage, so a deal in an early stage counts for less than one in late negotiation. Stage probabilities are set by each company.
- Formula:
Weighted pipeline = sum of (deal amount x stage probability) - Why it matters: It gives a more realistic read of expected revenue than the unweighted total.
- Why a KPI card: Placed beside open pipeline as another card, it can be compared with the unweighted total in one glance.
Pipeline coverage
- Definition: How many times the open pipeline covers the quota or target still to be closed. Teams often set a target ratio, commonly around 3x as a rule of thumb, but the right ratio varies by company and depends on win rate.
- Formula:
Pipeline coverage = open pipeline / remaining quota - Why it matters: It shows early whether there is enough pipeline to reach the number, while there is still time to add more.
- Why a KPI card with progress bar: The bar against the 3.0x target shows how far above or below target coverage sits, which the number alone does not.
Win rate
- Definition: The share of closed deals that were won in the period. Some companies count by deal number and others by value, so label which one the card uses.
- Formula:
Win rate = won deals / (won deals + lost deals) - Why it matters: It tells you how much pipeline is needed to hit a target and whether deal quality is changing.
- Why a KPI card: A single percentage with a point change suits a rate that moves slowly and is read as one figure.
Average sales cycle
- Definition: The average number of days from deal creation to close for won deals. Some teams start the clock at first meeting or qualification instead of creation.
- Formula:
Average sales cycle = average of (close date - created date) for won deals - Why it matters: It shows whether deals created now can still close inside the quarter.
- Why a KPI card: One number in days with a change versus last quarter is enough to see whether deals are getting faster or slower.
Pipeline by stage and stage conversion
- Definition: Open pipeline value and deal count in each stage, with the percentage that moves from one stage to the next. Stage names and definitions are specific to each company.
- Formula:
Stage conversion = deals reaching the next stage / deals that entered the stage - Why it matters: It shows where deals are lost or stall, so the team can see which stage needs attention.
- Why a funnel chart: Narrowing bars make the drop from stage to stage visible, and the percentages between bars show where deals leak, which a column chart does not emphasize.
Pipeline movement
- Definition: A bridge from pipeline at the start of the period to pipeline at the end: new pipeline created, deals won, deals lost and deals pushed out of the period.
- Formula:
Ending pipeline = starting pipeline + created - won - lost - pushed out - Why it matters: It explains why total pipeline changed, which a single total cannot.
- Why a waterfall chart: Floating bars show each increase and decrease between the starting and ending totals, so the reader sees which change moved the number most.
Open pipeline by source
- Definition: The share of open pipeline from each lead source, such as inbound, outbound, partner and expansion.
- Formula:
Source share = open pipeline from the source / total open pipeline - Why it matters: It shows how dependent the quarter is on one channel.
- Why a donut chart: With only four sources, slices show each channel's share of the whole, and the open total fits in the centre.
Deal aging by stage
- Definition: The number of open deals in each stage grouped by how many days they have been in that stage (0-30, 31-60, 61-90, 90+). Days in stage is today minus the date the deal entered its current stage.
- Formula:
Days in stage = today - stage entry date - Why it matters: Deals sitting in a stage far longer than usual are less likely to close, so they need a decision.
- Why a stacked bar chart: Each stage bar splits into age buckets, so the reader sees both how many deals are in a stage and how many of them are old.
Data you need to build this
- CRM (Salesforce, HubSpot or similar), opportunity or deal object Deal ID, Account name, Owner, Amount, Stage, Status (open, won, lost), Created date, Close date, Stage entry date, Lead source, Next step, Team and segment
- CRM stage history or field history Deal ID, Stage, Entered date, Exited date, Amount at each change, Close date at each change
- Quota or planning sheet Team, Fiscal period, Quota or target, Target coverage ratio
- Stage probability table Stage, Probability (set by your company)
Why it's laid out this way
- The five KPI cards come first, directly under the filters, so the question of whether the quarter is covered is answered before any chart is read. Coverage is the only card with a bar against target.
- The middle row reads left to right as a story: stages in the funnel show where value sits, the waterfall shows how it moved, and the donut shows where it came from. Funnel and waterfall use the same dollar scale as the open pipeline card.
- Detail sits at the bottom. The table and the aging chart share a row so the stale deals flagged in red can be matched to the stages where the aging bars show older deals, which turns the table into the agenda for the call.
Last updated:
More like this
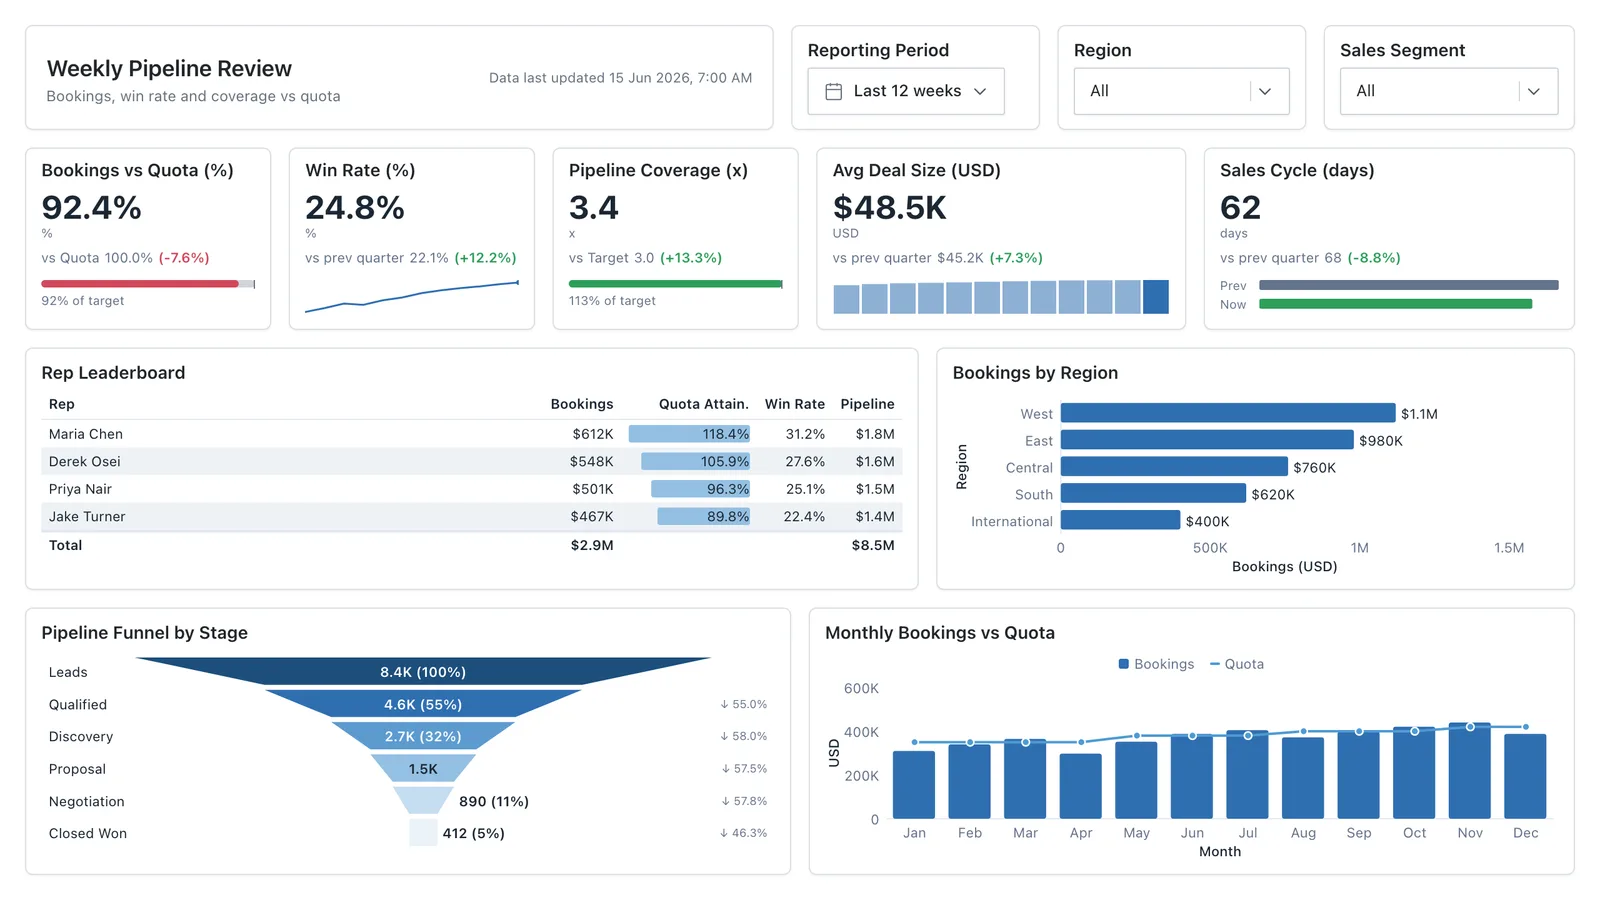
Sales Performance
Revenue, win rate, pipeline value, and rep performance across regions — the layout most sales teams build first.
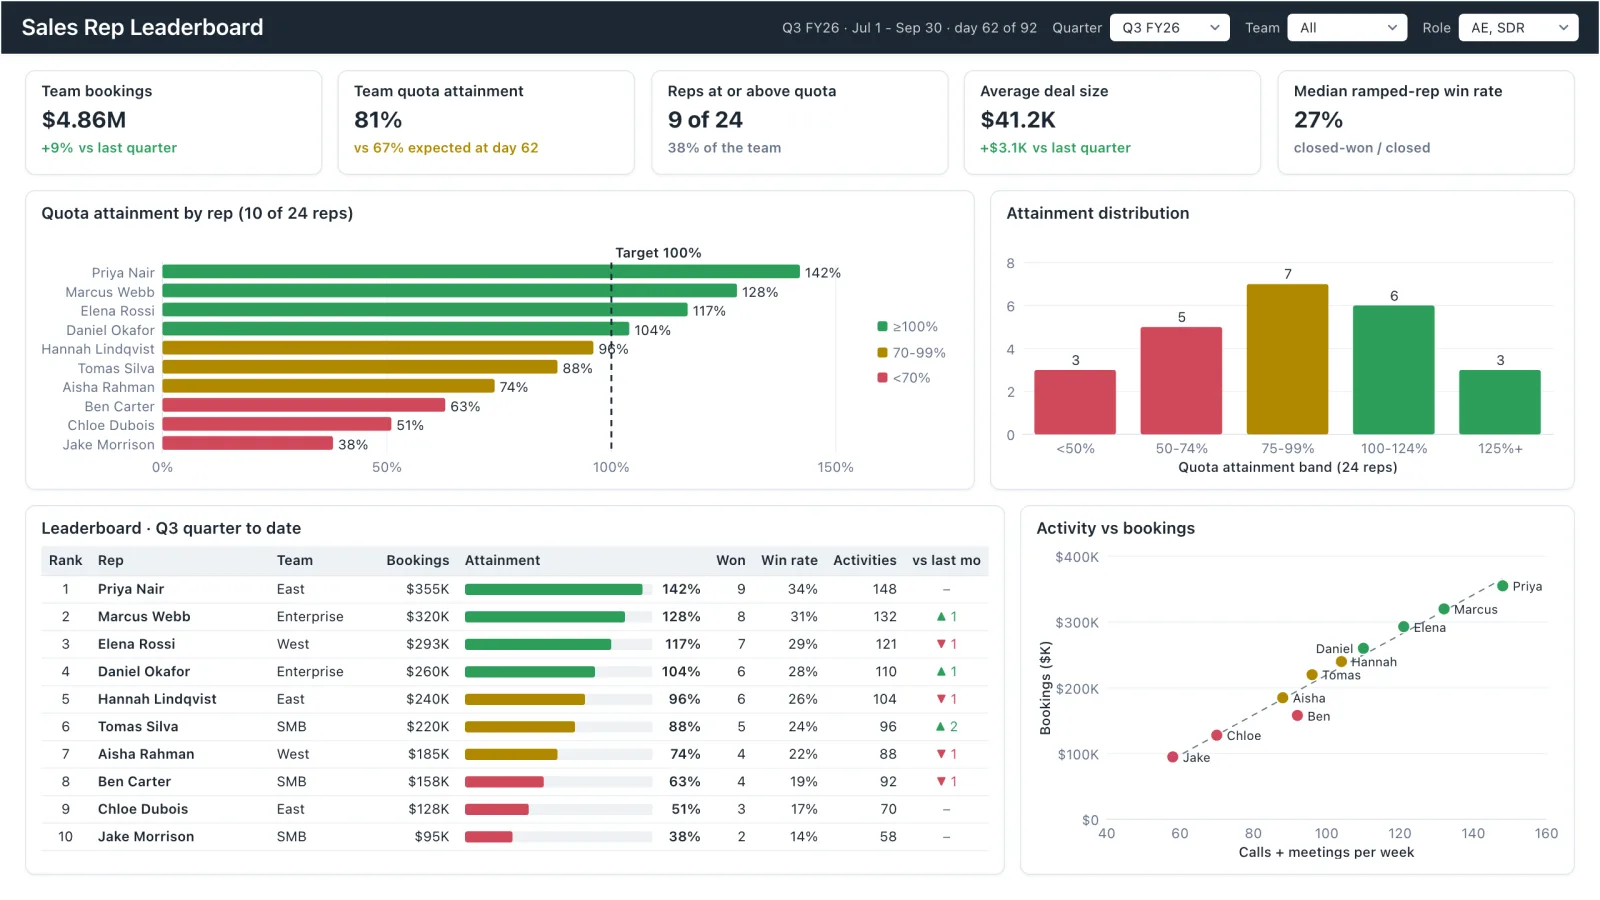
Sales Rep Leaderboard
Sales rep dashboard example with quota attainment by rep, a ranked leaderboard table and activity vs bookings.
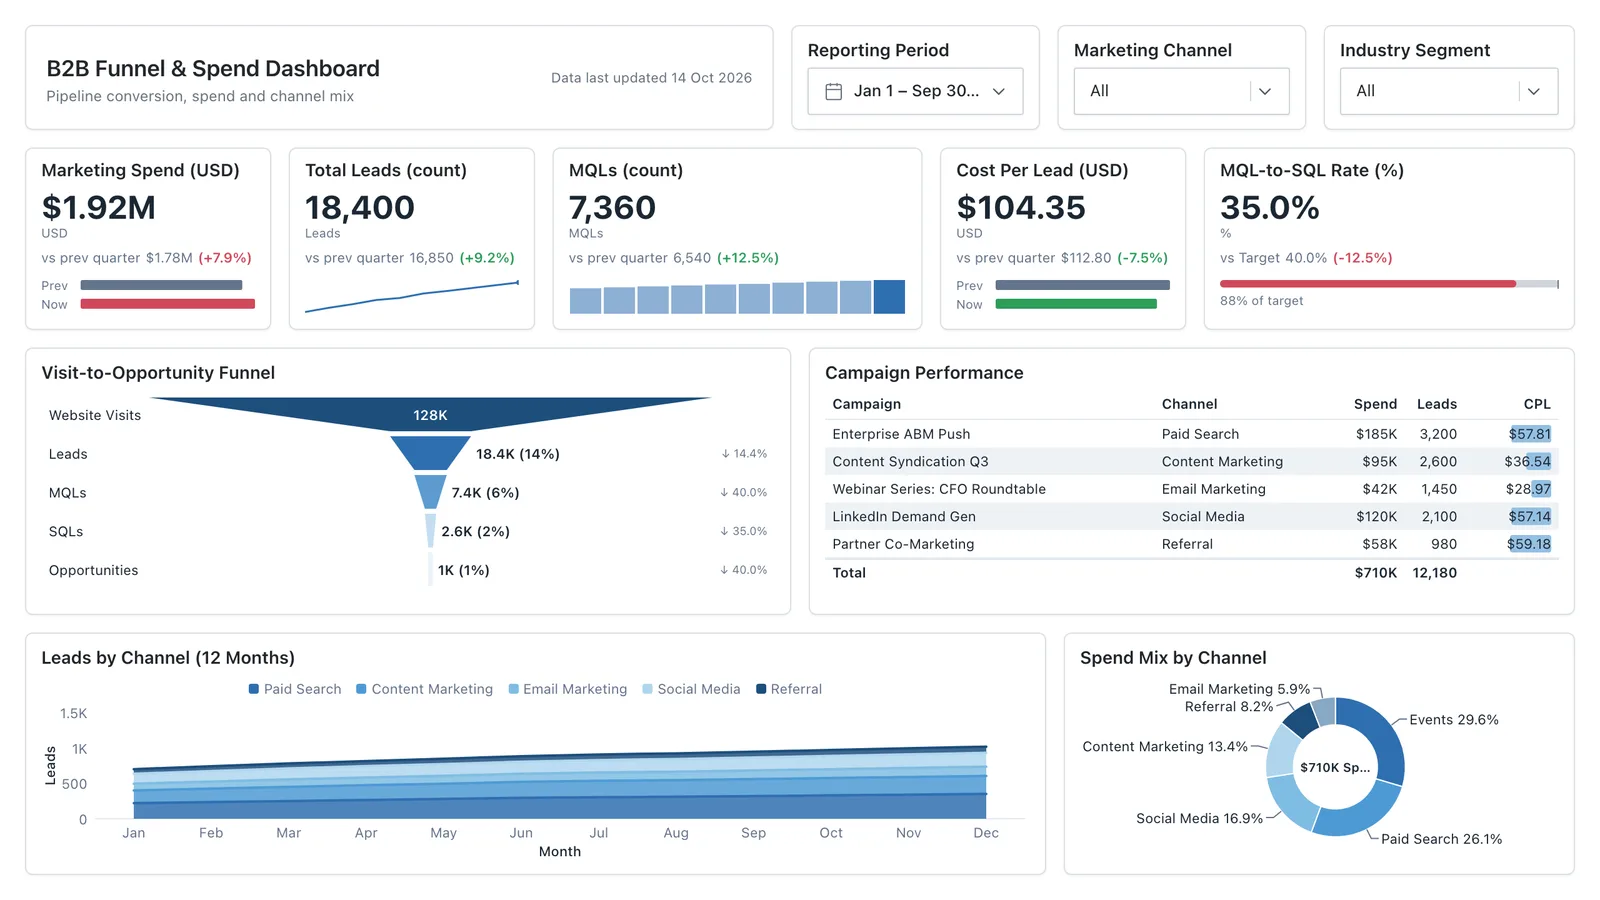
Marketing Analytics
Campaign spend, traffic sources, conversion funnel, and lead volume in one wireframe.
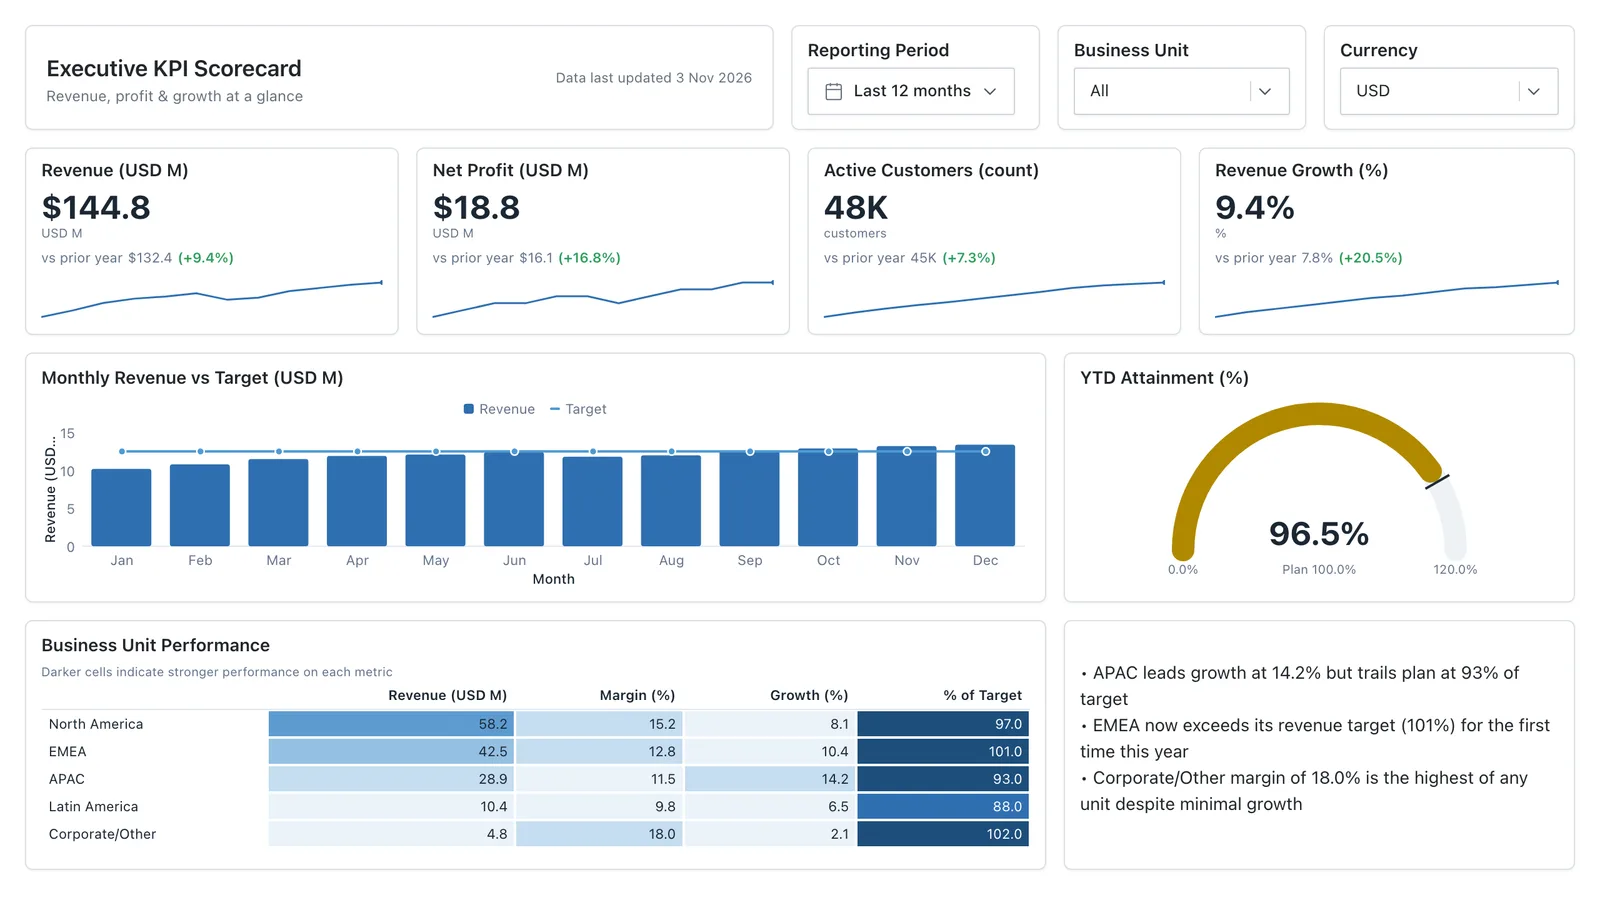
Executive KPI Overview
Single-page executive view of the metrics leadership cares about — built for the first client meeting.
Sales, finance, HR, SaaS, and more — filter by team or search by metric.