Healthcare Metrics Dashboard Mockup Template
The Healthcare Metrics dashboard template is a one-page clinical performance layout for hospital operations leaders and quality teams, built to decide whether capacity, length of stay and readmissions need action in a department. It shows admissions, bed occupancy, average length of stay, 30-day readmission rate and patient satisfaction.
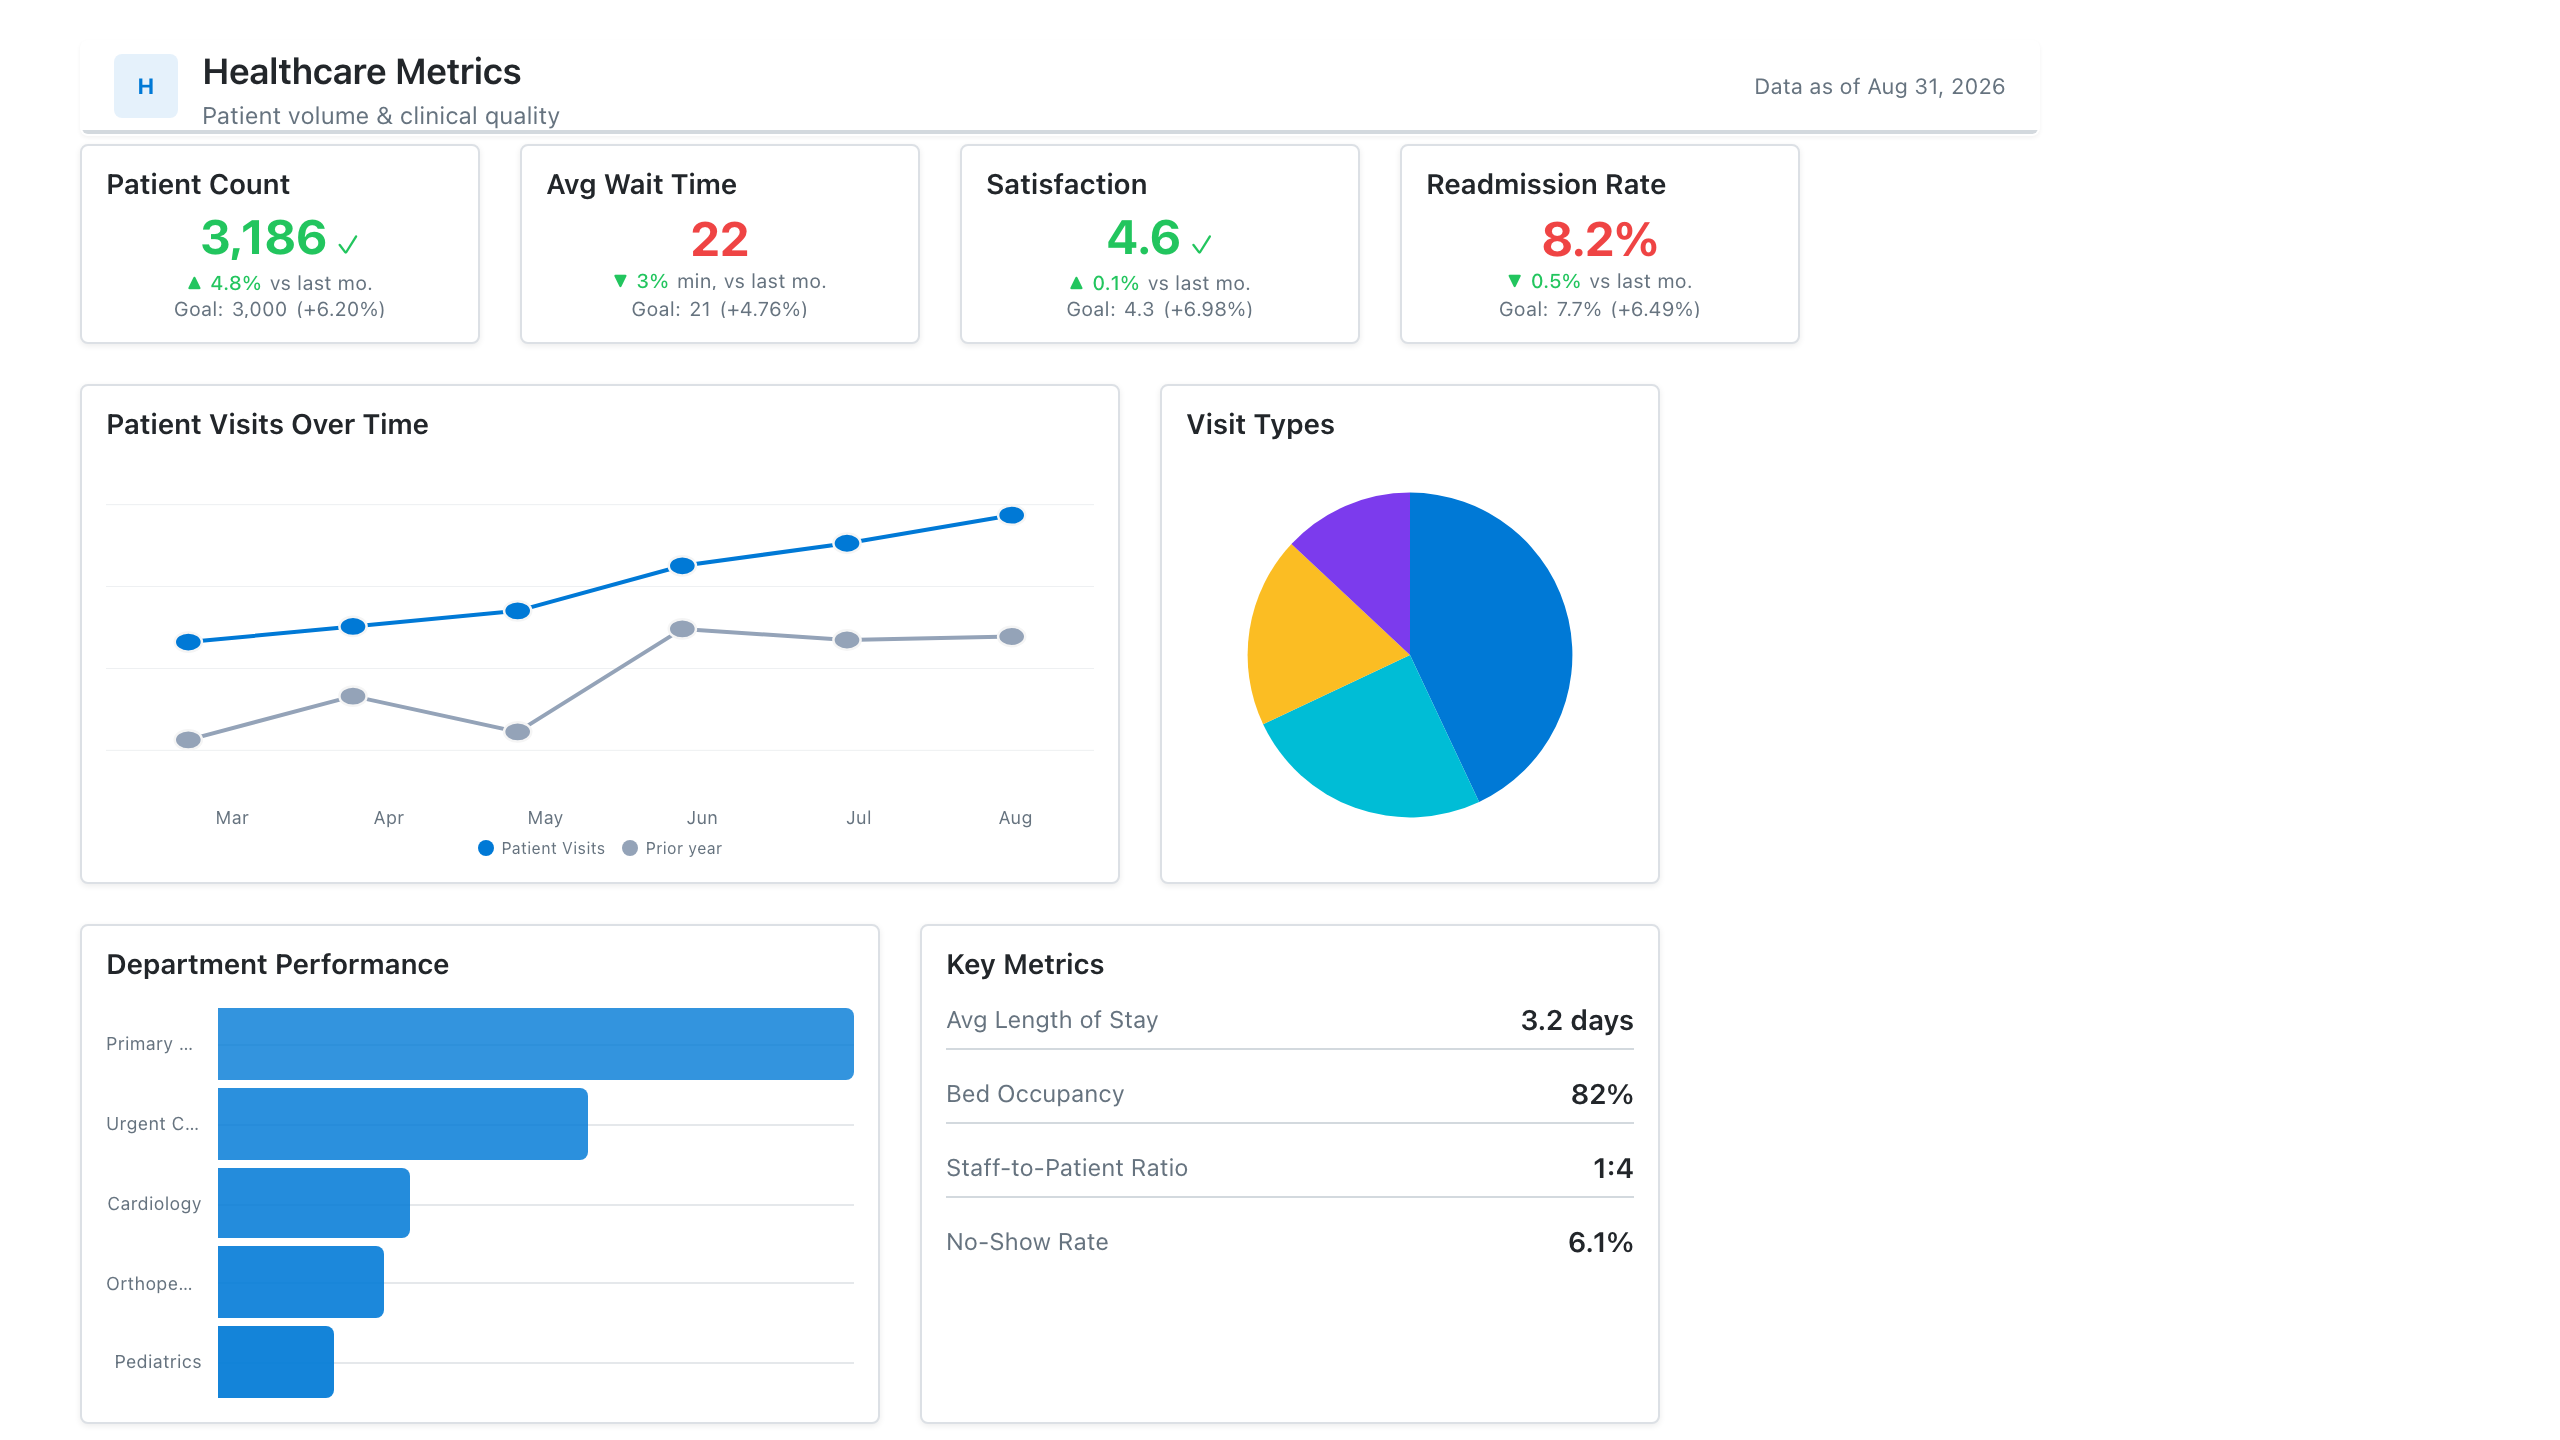
Click the mockup to open it full size
About this template
HealthcareA clinical-operations layout: patient-volume and length-of-stay KPIs, a readmission-rate trend, and performance by department or service line. Wireframe the structure and get clinical sign-off before touching the EHR data.
Metrics this dashboard tracks
- Patient volume / census
- Average length of stay
- 30-day readmission rate
- Bed occupancy
- ED wait time
- Performance by service line
What's on the Healthcare Metrics dashboard?
| Section | What it shows | Why it's here |
|---|---|---|
| Header and filters Title card, date range picker, two dropdown filters | The report title ("Hospital Clinical Performance Command Center"), a subtitle, a data last updated timestamp, and filters for reporting period, department and patient type. | Lets one page serve every department and period, so the reader confirms the scope and data freshness before reading any figure. |
| KPI row Five KPI cards | Patient admissions (2,540), bed occupancy rate (84.3%), average length of stay (4.6 days), 30-day readmission rate (11.8%) and patient satisfaction score (88.4%), each with the previous month value and a percentage change. | Gives the month in five numbers covering volume, capacity, efficiency, quality and experience, so leaders see at once which area moved before reading a chart. |
| Trend and wait time row Line chart with a threshold line, horizontal bar chart | Monthly inpatient and emergency admissions from January to December against a dashed capacity threshold, beside average ED wait time in minutes by department. | The trend shows whether admissions are heading toward capacity, and the ranked bars show which departments have the longest waits, so staffing and flow effort goes where it is needed. |
| Department and satisfaction row Table, donut chart | A department performance summary (admissions, average length of stay, readmission rate, satisfaction, with a total row) beside a donut of patient satisfaction ratings (excellent, good, fair, poor) with the overall score in the centre. | The table lets each department be compared on the same four measures to find outliers, and the donut shows how the satisfaction score is made up of ratings. |
What each metric means
Patient admissions
- Definition: The number of patients formally admitted to the hospital in the period. Hospitals differ on whether observation stays and same-day cases are counted, so state which ones are included.
- Formula:
Admissions = count of admission events in the period - Why it matters: It is the main volume measure and the starting point for staffing, bed planning and every rate on the page.
- Why a KPI card: A single large count with the change from last month gives the volume headline at a glance.
Bed occupancy rate
- Definition: The share of available beds that are occupied. It can be measured from a midnight census or from bed-days used, so say which method your hospital uses.
- Formula:
Bed occupancy rate = occupied bed-days / available bed-days - Why it matters: High occupancy leaves little room for surges and can delay admissions from the emergency department.
- Why a KPI card: A percentage with a change from last month is read as one figure and compared with an internal target.
Average length of stay
- Definition: The average number of days patients spend in hospital per admission, usually for discharged patients in the period. Day-case handling and outlier trimming vary by organisation.
- Formula:
Average length of stay = total inpatient days / number of discharges - Why it matters: Longer stays use beds and can signal delays in care, discharge or placement, so it links directly to capacity.
- Why a KPI card: One number in days with a change versus last month shows whether stays are getting shorter or longer.
30-day readmission rate
- Definition: The share of discharged patients who return to hospital within 30 days. Programmes define the qualifying stays and whether only unplanned returns count differently, so document your definition.
- Formula:
Readmission rate = readmissions within 30 days / eligible discharges - Why it matters: It is a widely used quality signal for discharge planning and follow-up care.
- Why a KPI card: A slow-moving rate suits a single figure with a month-on-month change, where lower is better.
Patient satisfaction score
- Definition: The overall percentage of patients who rate their experience favourably in a survey. The survey instrument and the ratings counted as favourable differ between hospitals.
- Formula:
Satisfaction score = favourable responses / total responses - Why it matters: It adds the patient view to measures of volume and efficiency.
- Why a KPI card: A single percentage with a change from last month makes the experience trend easy to scan next to the clinical measures.
Patient admissions trend and capacity threshold
- Definition: Monthly inpatient admissions and emergency admissions plotted over the year, with a dashed line marking the capacity threshold the hospital sets for itself.
- Why it matters: It shows seasonality and whether admissions are approaching the level the hospital can safely handle.
- Why a line chart: Lines show direction over time, and the threshold line makes it clear when a series gets close to the limit.
ED wait time by department
- Definition: The average number of minutes patients wait, shown for each department. Teams often measure from arrival to first clinician contact, but start and stop points vary, so label them.
- Formula:
Average wait = average of (time seen - arrival time) in minutes - Why it matters: Long waits affect patient safety and experience, so ranking departments shows where to add staff or fix flow.
- Why a bar chart: Horizontal bars sorted longest to shortest compare departments on one scale and fit long department names.
Department performance summary
- Definition: A table of admissions, average length of stay, readmission rate and satisfaction for each department, with a total row for admissions.
- Why it matters: It lets the reader compare departments on the same measures and find the outlier behind a headline number.
- Why a table: Four measures per department are easiest to compare exactly when laid out in aligned columns.
Patient satisfaction breakdown
- Definition: The share of survey responses in each rating band: excellent, good, fair and poor. The overall score is shown in the centre.
- Formula:
Rating share = responses in the band / total responses - Why it matters: It shows whether the overall score is held up by many excellent ratings or hides a poor tail.
- Why a donut chart: With four ordered bands that add up to 100 percent, slices show each share of the whole and the centre holds the headline score.
Data you need to build this
- EHR or patient administration system (ADT feed) Encounter ID, Patient ID (de-identified for reporting), Admission date and time, Discharge date and time, Admission type (inpatient, emergency), Department or service line, Patient type
- Bed management or capacity system Ward, Staffed or available beds, Occupied beds by day, Capacity threshold set by the hospital
- Emergency department tracking system Arrival time, Time first seen, Department, Date
- Patient experience survey platform Survey response ID, Department, Overall rating, Response date
Why it's laid out this way
- The five KPI cards sit directly under the filters so volume, capacity, length of stay, readmissions and satisfaction are read first. Each carries the previous month value so the direction is clear without opening a chart.
- The middle row pairs the admissions trend with ED wait times. The dashed capacity threshold on the line chart makes the question of nearing the limit visible, while the bars rank departments by wait in minutes.
- Detail sits at the bottom: the department table gives exact figures for comparison, and the donut chart next to it explains what sits behind the satisfaction score in the KPI row above.
Last updated:
More like this
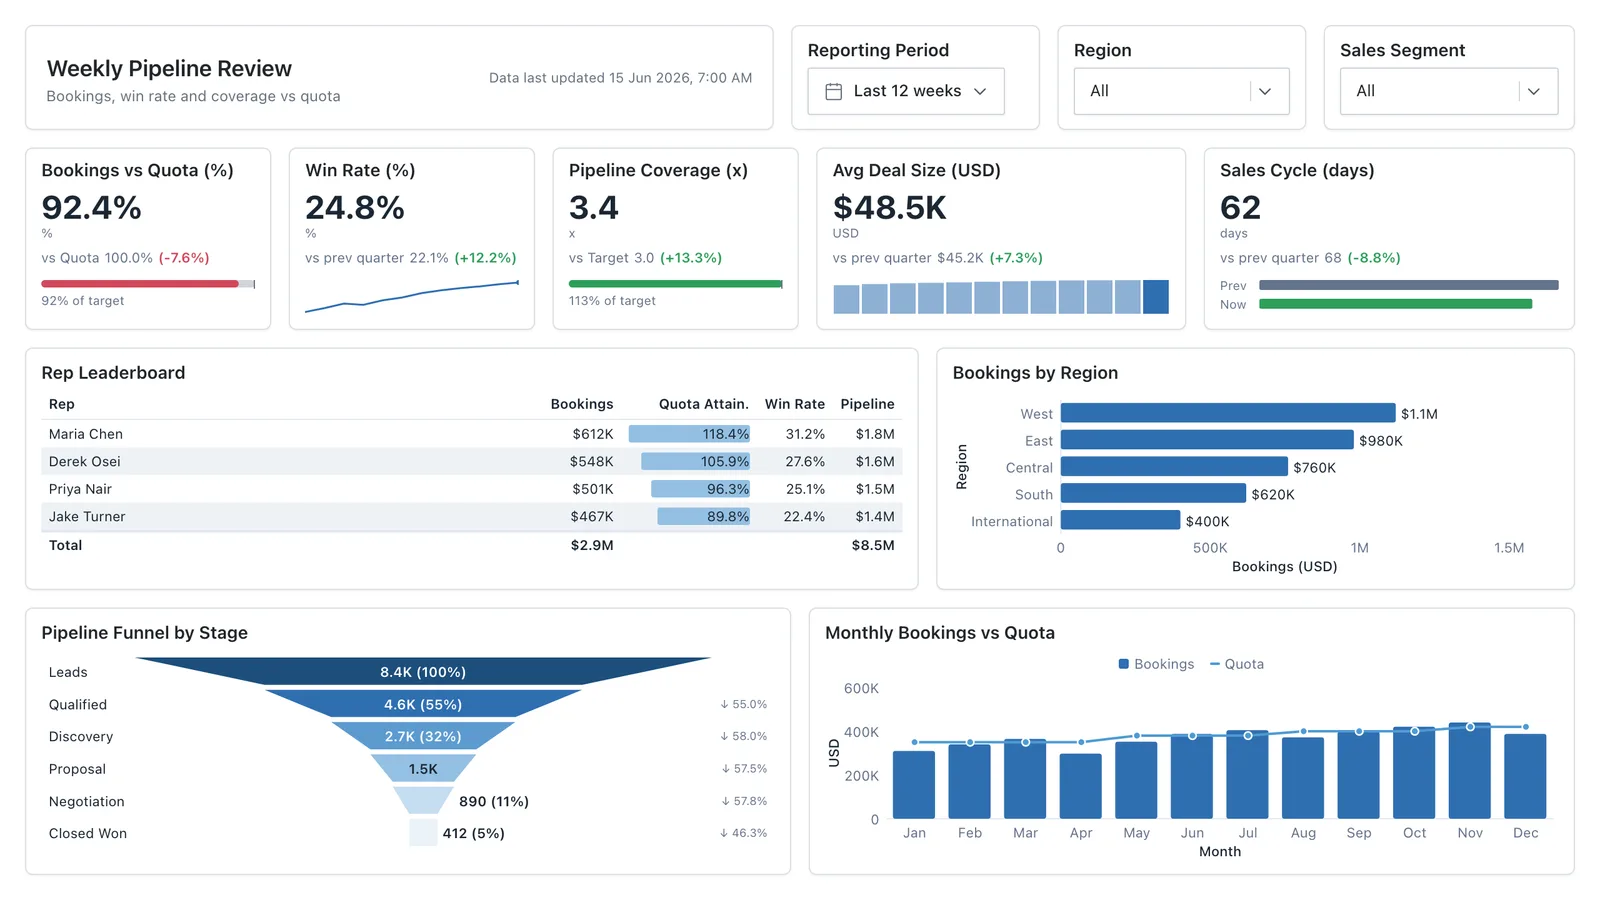
Sales Performance
Revenue, win rate, pipeline value, and rep performance across regions — the layout most sales teams build first.
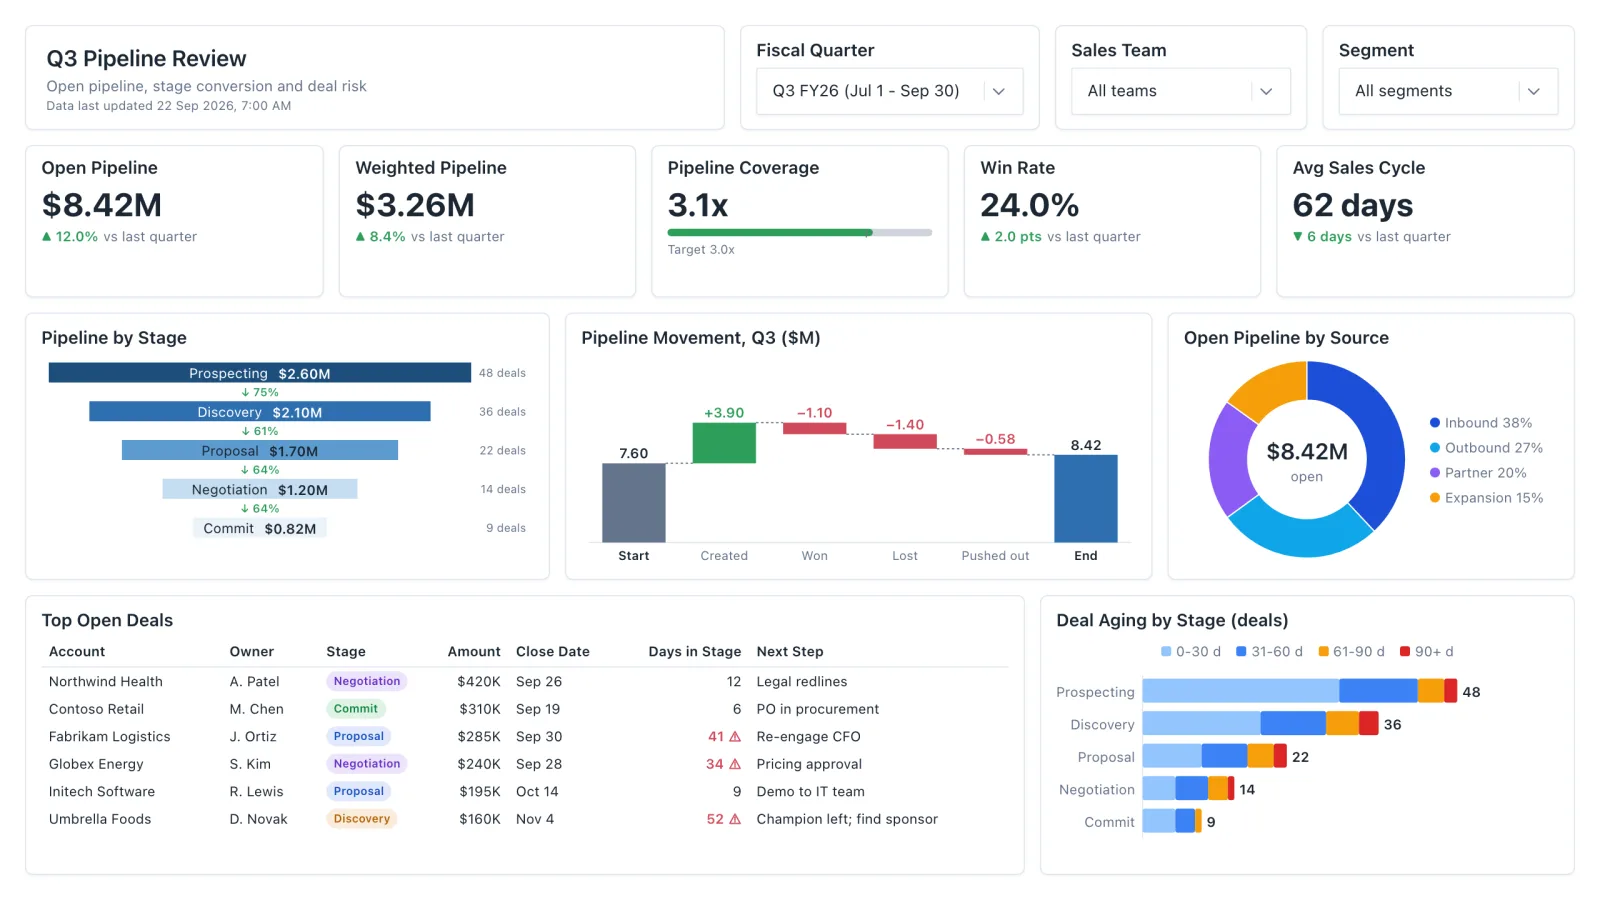
Sales Pipeline
Sales pipeline dashboard with open and weighted pipeline, coverage vs target, a stage funnel and stale-deal flags.
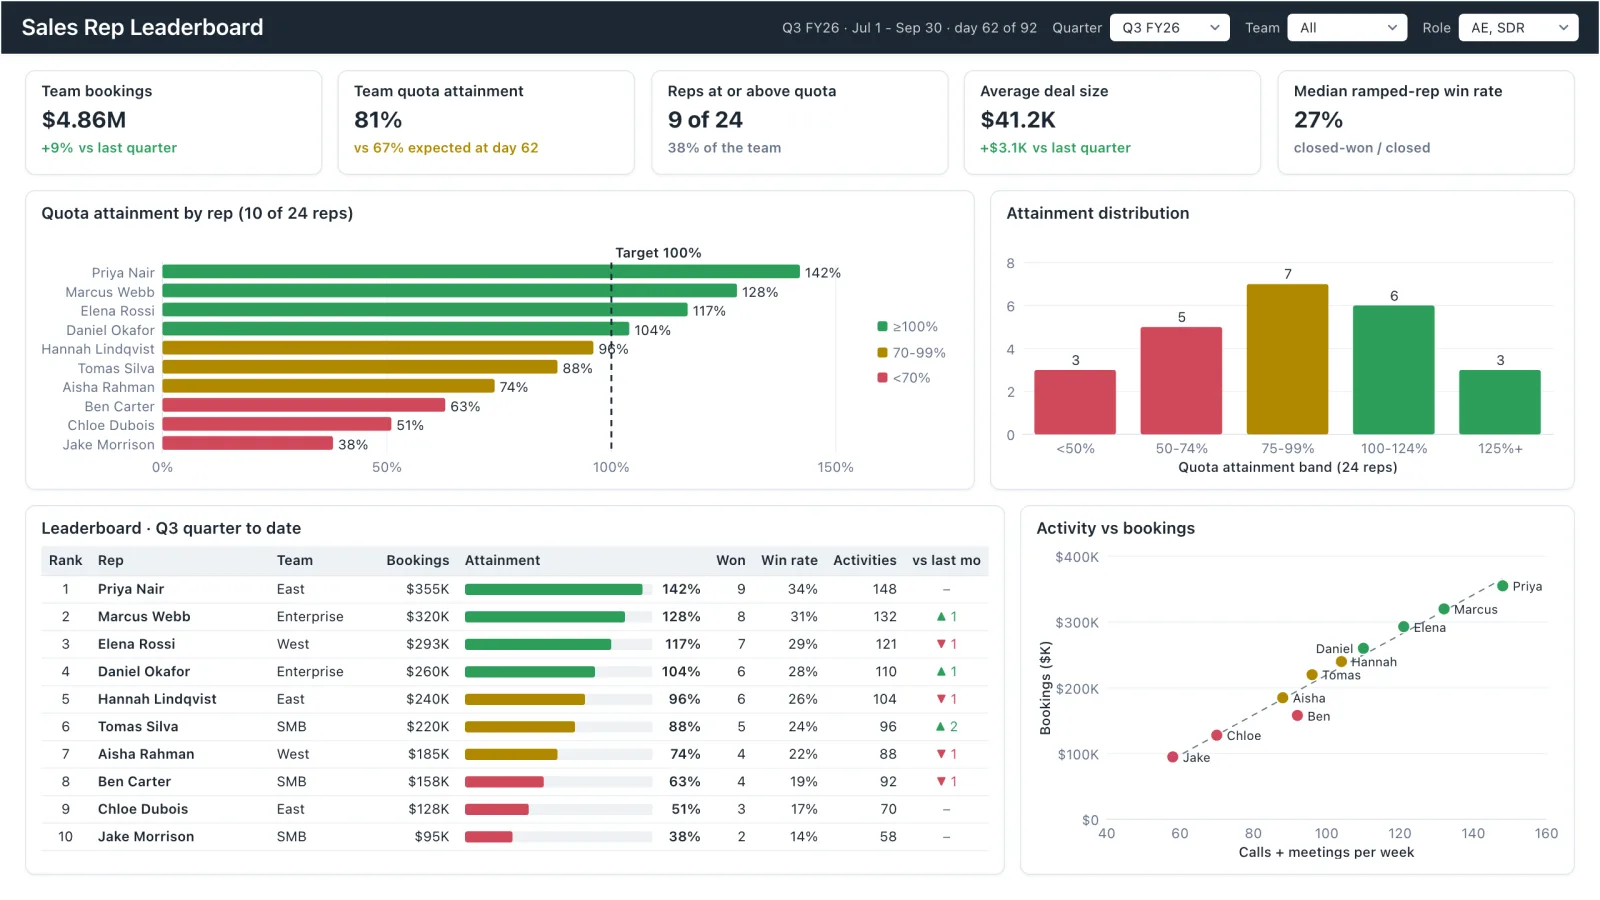
Sales Rep Leaderboard
Sales rep dashboard example with quota attainment by rep, a ranked leaderboard table and activity vs bookings.
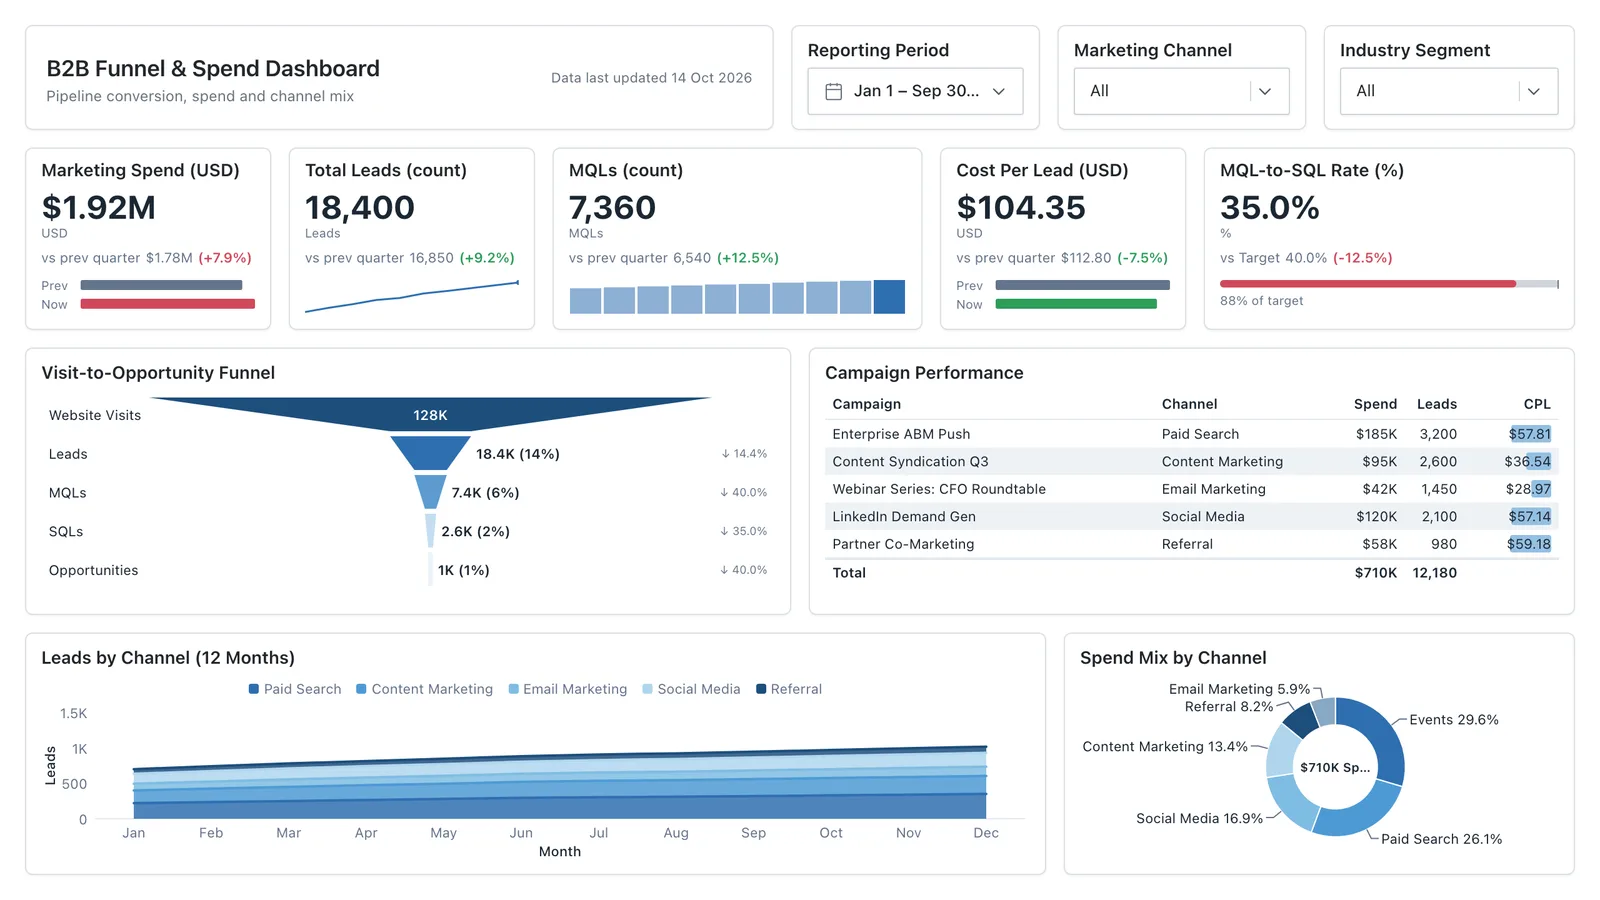
Marketing Analytics
Campaign spend, traffic sources, conversion funnel, and lead volume in one wireframe.
Sales, finance, HR, SaaS, and more — filter by team or search by metric.