HR & People Dashboard Mockup Template
The HR & People dashboard template is a one-page layout for HR leaders and people analysts, built to decide whether headcount, attrition and hiring are on course and which departments need attention. It shows headcount, net change, attrition, regretted attrition, time to hire, engagement score and a hiring funnel.
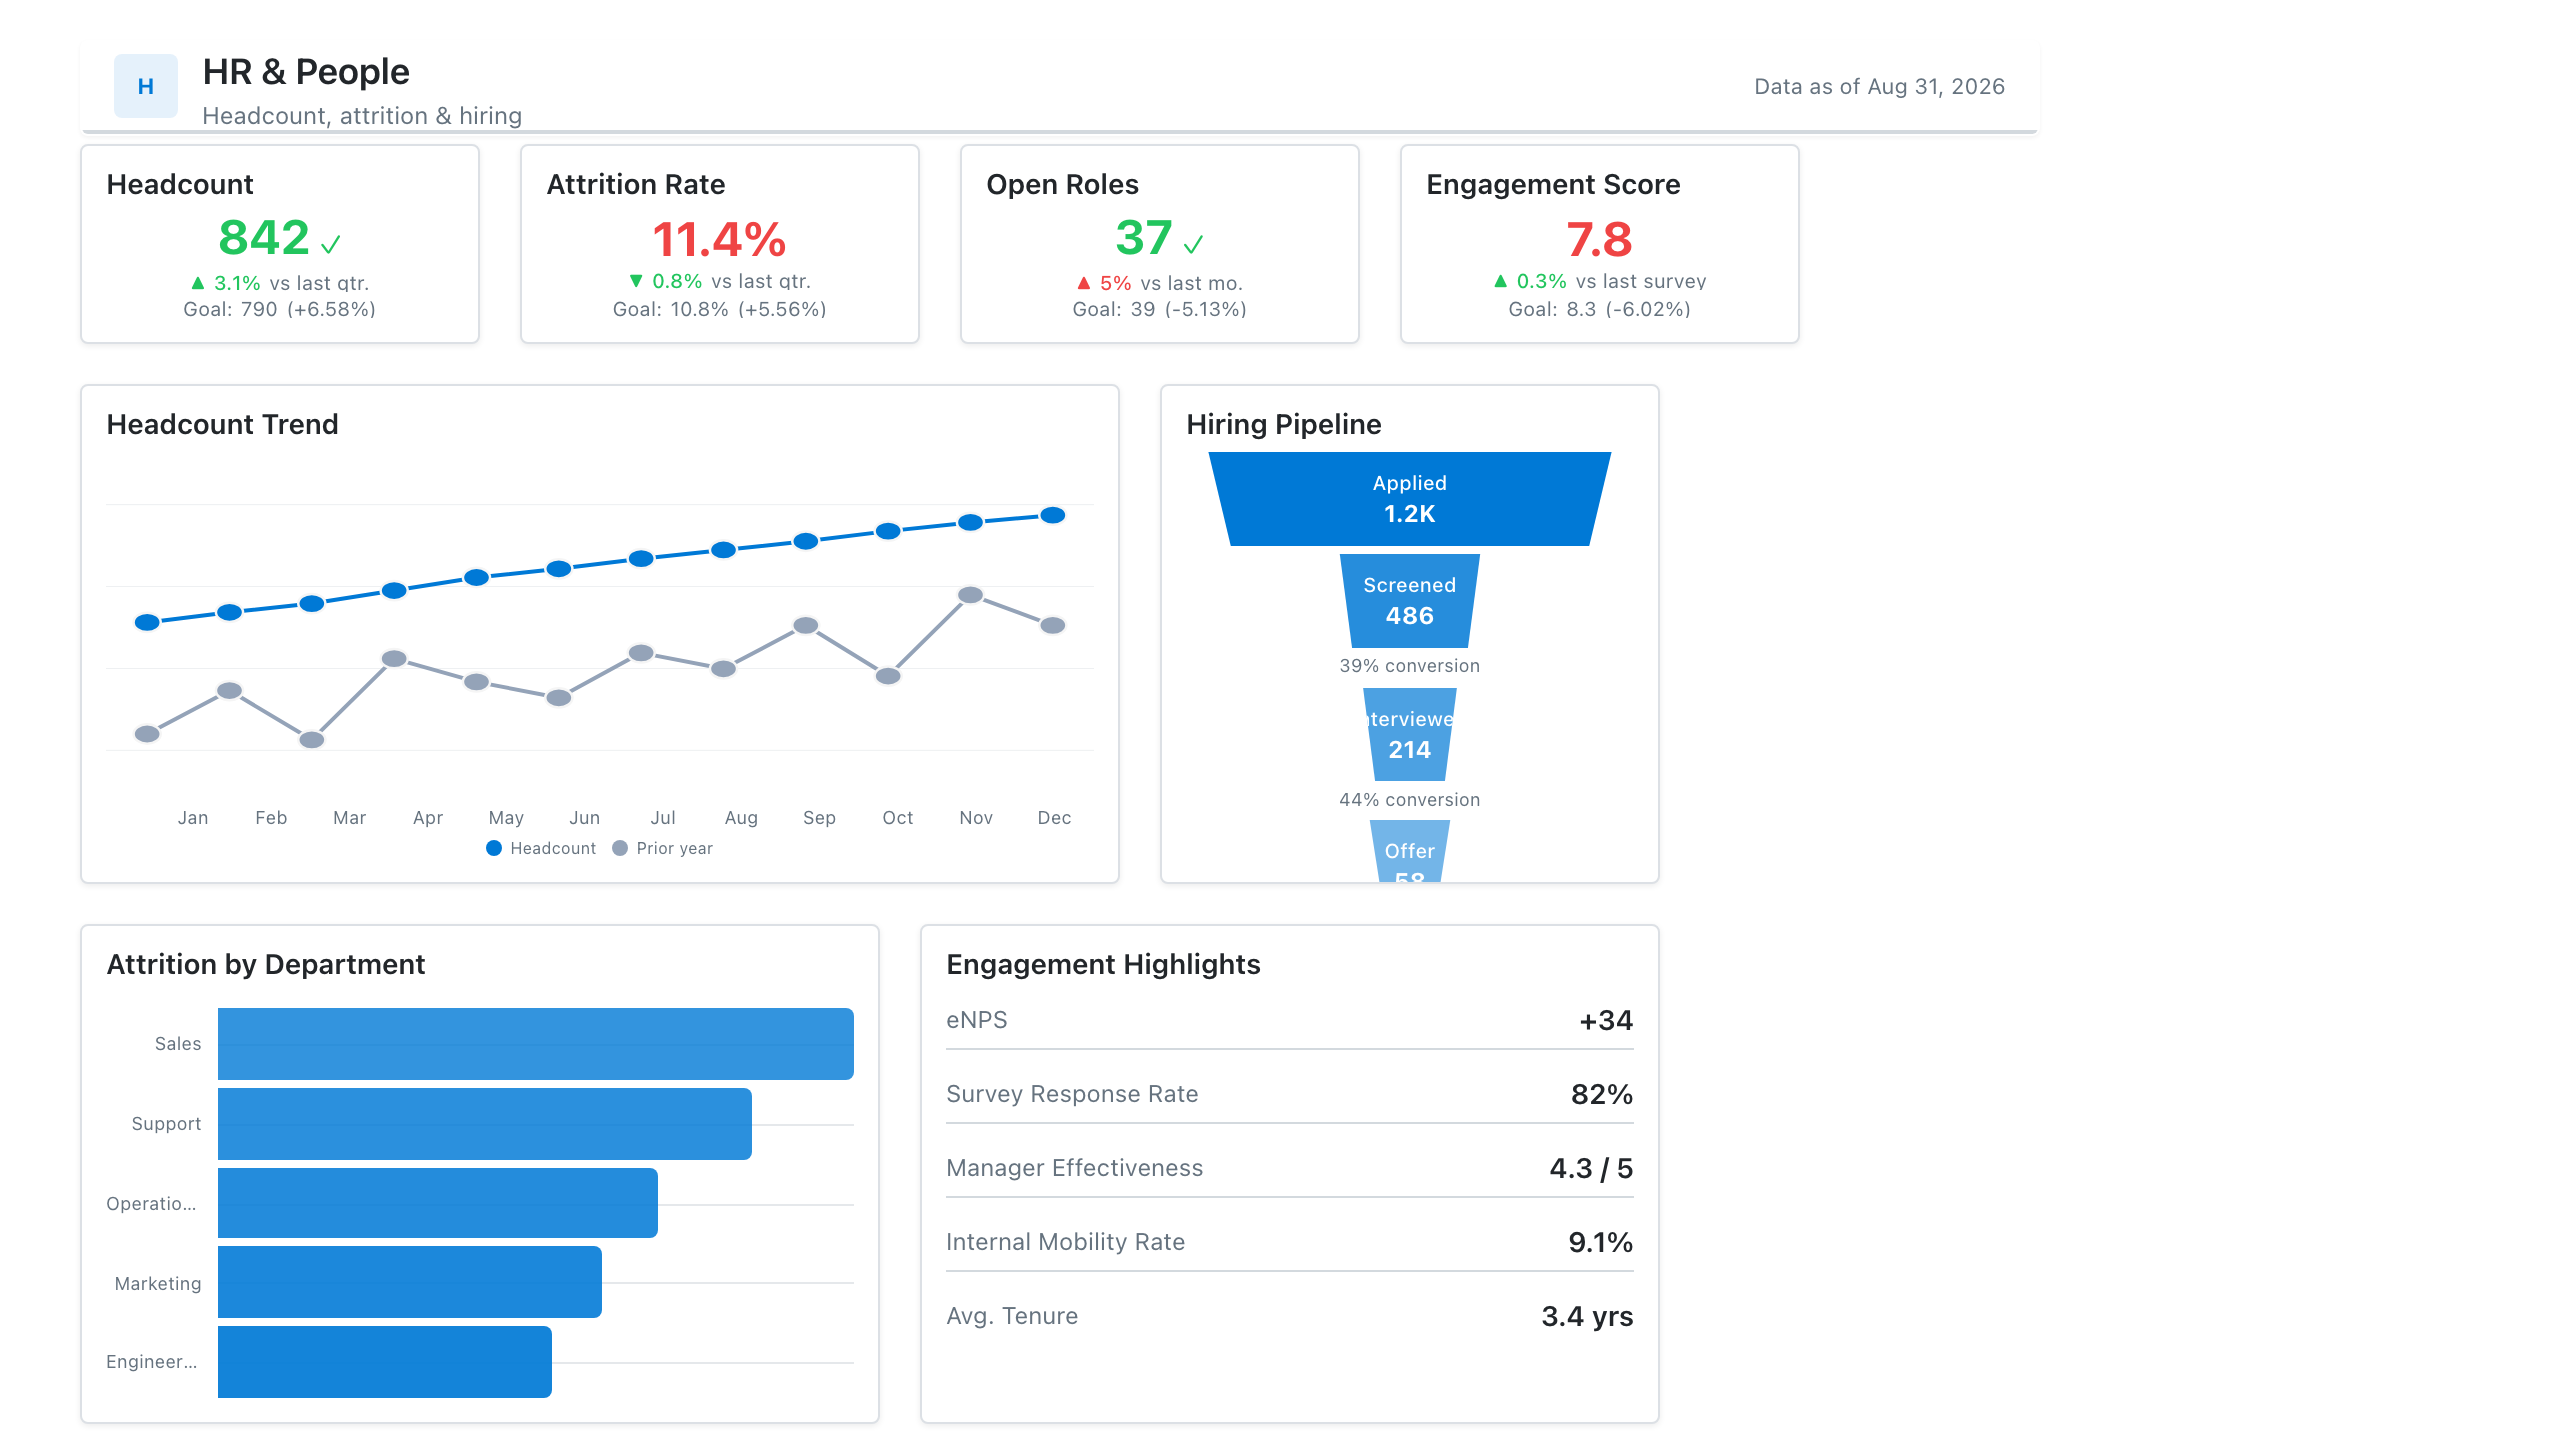
Click the mockup to open it full size
About this template
HRPeople-team reporting on one screen: headcount and attrition KPIs, a hiring-pipeline funnel, and engagement or diversity breakdowns. Useful for the board deck and the monthly leadership people review alike.
Metrics this dashboard tracks
- Headcount & net change
- Attrition / regretted attrition
- Time to hire
- Hiring pipeline by stage
- Engagement score
- Headcount by department / level
What's on the HR & People dashboard?
| Section | What it shows | Why it's here |
|---|---|---|
| Header and filters Title card, date range picker, two dropdown filters | The title ("HR & People Performance Dashboard"), a subtitle, a data last updated date, and filters for reporting period, department and location. | Lets one page serve any department, location and year, and tells the reader how fresh the data is before they interpret it. |
| KPI row Six KPI cards | Total headcount, net headcount change, attrition rate, regretted attrition rate, time to hire and engagement score, each with a comparison (previous month, previous quarter or target). | Gives the people-team health check in one row: how big the organisation is, whether it is growing, who is leaving, how fast hiring runs and how engaged employees are. |
| Headcount trend and hiring pipeline Combo chart (columns and line), funnel chart | Twelve months of headcount as columns with net change as a line on a second axis, beside a hiring funnel from applications through screened, interviewed, offers extended, offers accepted and hired, with counts, share of applications and stage-to-stage percentages. | The trend shows whether growth is steady and the funnel shows where candidates fall away, so the reader can tell if hiring pace comes from demand or from a bottleneck. |
| Department detail row Matrix with colour shading, table with data bars | Headcount by department for each quarter (Engineering and Sales, with a total row), where darker cells mean higher headcount, beside an annual table of headcount, voluntary attrition, regretted attrition and attrition rate by department with a total row. | Breaks the company totals into departments, so the reader can see which team has the highest attrition and whether its headcount is growing or shrinking. |
What each metric means
Total headcount
- Definition: The number of employees on payroll at the end of the period. Some companies count full-time equivalents or include contractors, so state which one you use.
- Formula:
Headcount = count of active employees at period end - Why it matters: It is the base for most other people metrics and shows the size of the organisation.
- Why a KPI card: One large number with a comparison to the previous month gives the current size at a glance.
Net headcount change
- Definition: The change in headcount over the period: employees who joined minus employees who left.
- Formula:
Net change = hires - leavers - Why it matters: It shows whether the organisation is growing or shrinking, and how fast.
- Why a KPI card: A single signed number with a comparison to the previous month is enough for a figure read as a direction.
Attrition rate
- Definition: The share of employees who left in the period. Definitions vary: some include all leavers and others only voluntary leavers, and the rate is usually annualised. In this layout the department table uses voluntary leavers.
- Formula:
Attrition rate = leavers in the period / average headcount in the period - Why it matters: It shows how quickly the company loses people, which drives replacement cost and lost knowledge.
- Why a KPI card: A percentage with a change versus the previous quarter suits a rate that is reviewed against its own history.
Regretted attrition rate
- Definition: The share of employees who left whom the company would have preferred to keep, such as high performers or people in critical roles. How a leaver is classed as regretted is a management judgement and varies by company.
- Formula:
Regretted attrition rate = regretted leavers / average headcount - Why it matters: It separates the losses that hurt from healthy turnover, which total attrition alone does not.
- Why a KPI card: Placed beside the attrition card, it can be read against the total rate in one glance.
Time to hire
- Definition: The number of days to fill a role. Companies start the clock at different points, such as the job opening, the application or the first contact, and stop it at offer acceptance or start date.
- Formula:
Time to hire = date of hire or offer acceptance - start date of the measurement - Why it matters: It shows how long open roles stay unfilled, and long delays mean lost capacity.
- Why a KPI card: One number in days with a change versus the previous quarter is enough to see if hiring is getting faster.
Engagement score
- Definition: An index from an employee survey that summarises how engaged employees are. Survey questions, scale and scoring are specific to each company, so scores are not comparable across companies.
- Why it matters: It gives an early read on morale that headcount and attrition only show after people leave.
- Why a KPI card: An index compared with a target of 80 is read as one number and its gap to goal.
Headcount trend and net change
- Definition: Headcount at the end of each month shown as columns, with the net headcount change for the month as a line on a second axis.
- Why it matters: It shows whether growth is steady or comes in bursts, and whether net change is slowing.
- Why a combo chart: Columns suit a stock such as headcount and the line suits a monthly change, so both can be read over the same months.
Hiring pipeline by stage
- Definition: The number of candidates at each stage from application to hire, with each stage shown as a share of applications and as a percentage of the stage before. Stage names are specific to each company.
- Formula:
Stage conversion = candidates reaching the stage / candidates in the previous stage - Why it matters: It shows where candidates drop out, which points to sourcing, screening or offer problems.
- Why a funnel chart: Narrowing bars show the loss from stage to stage, and the percentages beside them show which stage loses most.
Headcount by department and quarter
- Definition: Headcount for each department at the end of each quarter, with totals, shaded so higher headcount is darker.
- Why it matters: It shows which departments grew and where headcount is concentrated.
- Why a matrix with colour shading: A matrix keeps exact numbers for departments across quarters, and the shading shows the larger values without a separate chart.
Attrition by department
- Definition: For each department, the headcount, the number of voluntary leavers, the number of regretted leavers and the attrition rate, with a total row. The rate here is voluntary leavers divided by headcount for the year.
- Formula:
Department attrition rate = voluntary leavers / department headcount - Why it matters: It locates attrition, so retention effort goes to the departments where it is highest.
- Why a table: A table gives the exact counts behind each rate, and data bars in the rate column make the highest departments stand out.
Data you need to build this
- HRIS (Workday, BambooHR, SAP SuccessFactors or similar) Employee ID, Department, Location, Job level, Hire date, Termination date, Termination type (voluntary or involuntary), Regretted flag, Employment status
- Applicant tracking system (Greenhouse, Lever, Workday Recruiting or similar) Requisition ID, Candidate ID, Department, Stage, Stage entered date, Offer date, Offer accepted date, Start date
- Engagement survey tool (Culture Amp, Qualtrics or similar) Survey date, Department, Response count, Engagement score, Target score
- Headcount snapshots or planning sheet Month end date, Department, Headcount, Planned headcount
Why it's laid out this way
- Six KPI cards sit directly under the filters, ordered from size (headcount, net change) to loss (attrition, regretted attrition) to speed and sentiment (time to hire, engagement), so the people health check reads in one pass.
- The middle row pairs the headcount trend with the hiring funnel: the left shows how the organisation is changing and the right shows how new people are arriving, which lets the reader judge hiring pace against growth.
- The bottom row splits totals by department, with a shaded matrix for headcount and a table for attrition, side by side so a department with high attrition can be checked against its headcount movement.
Last updated:
More like this
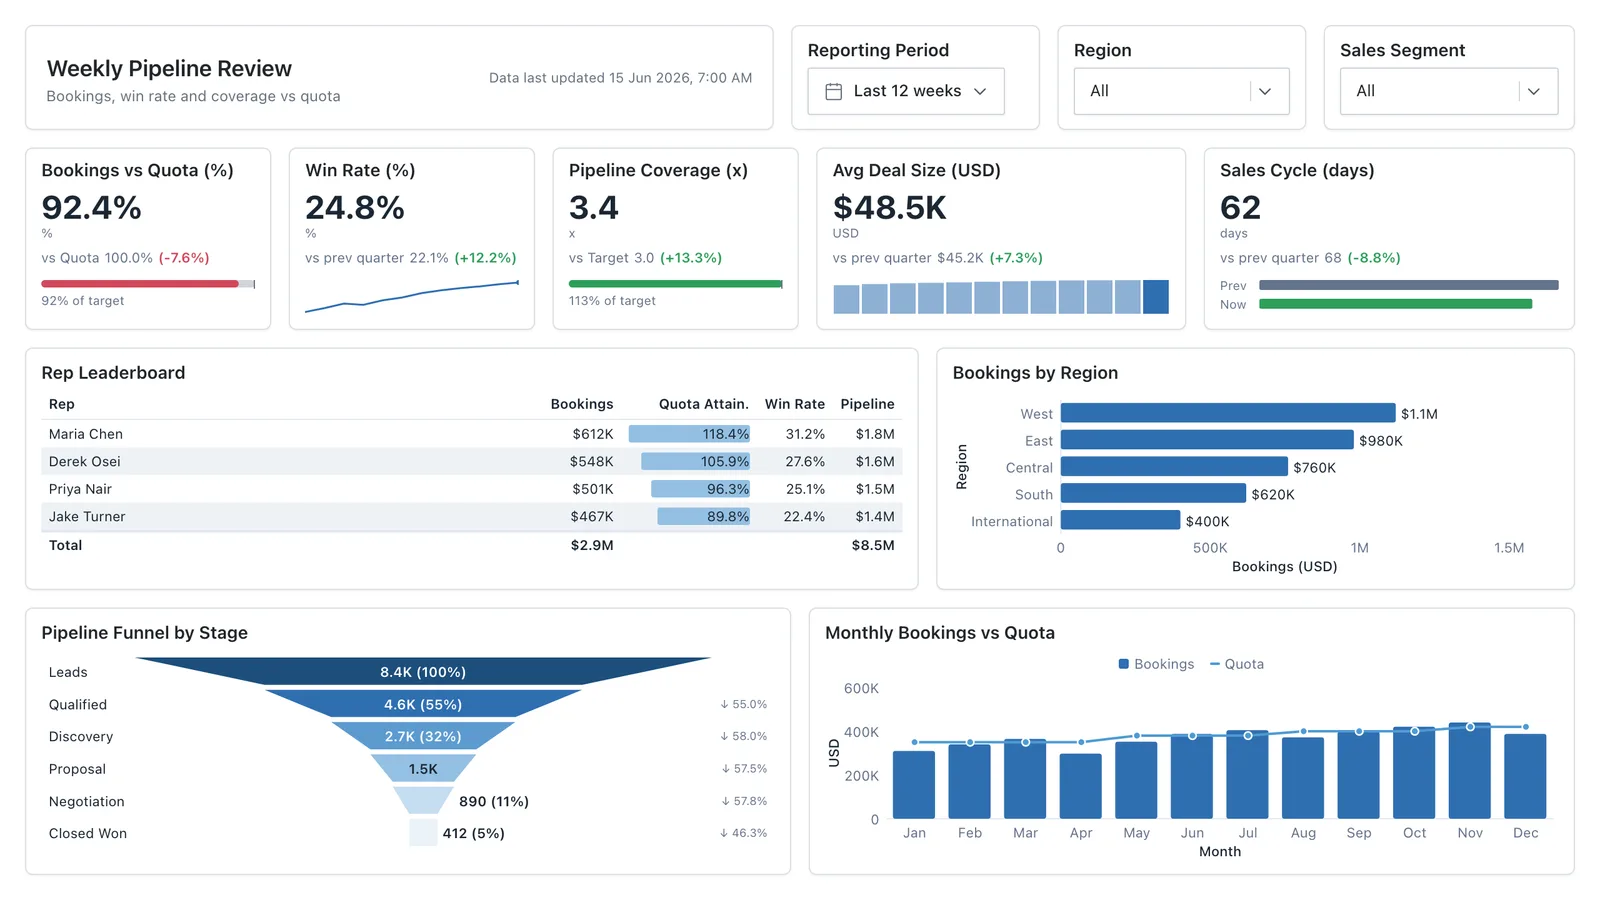
Sales Performance
Revenue, win rate, pipeline value, and rep performance across regions — the layout most sales teams build first.
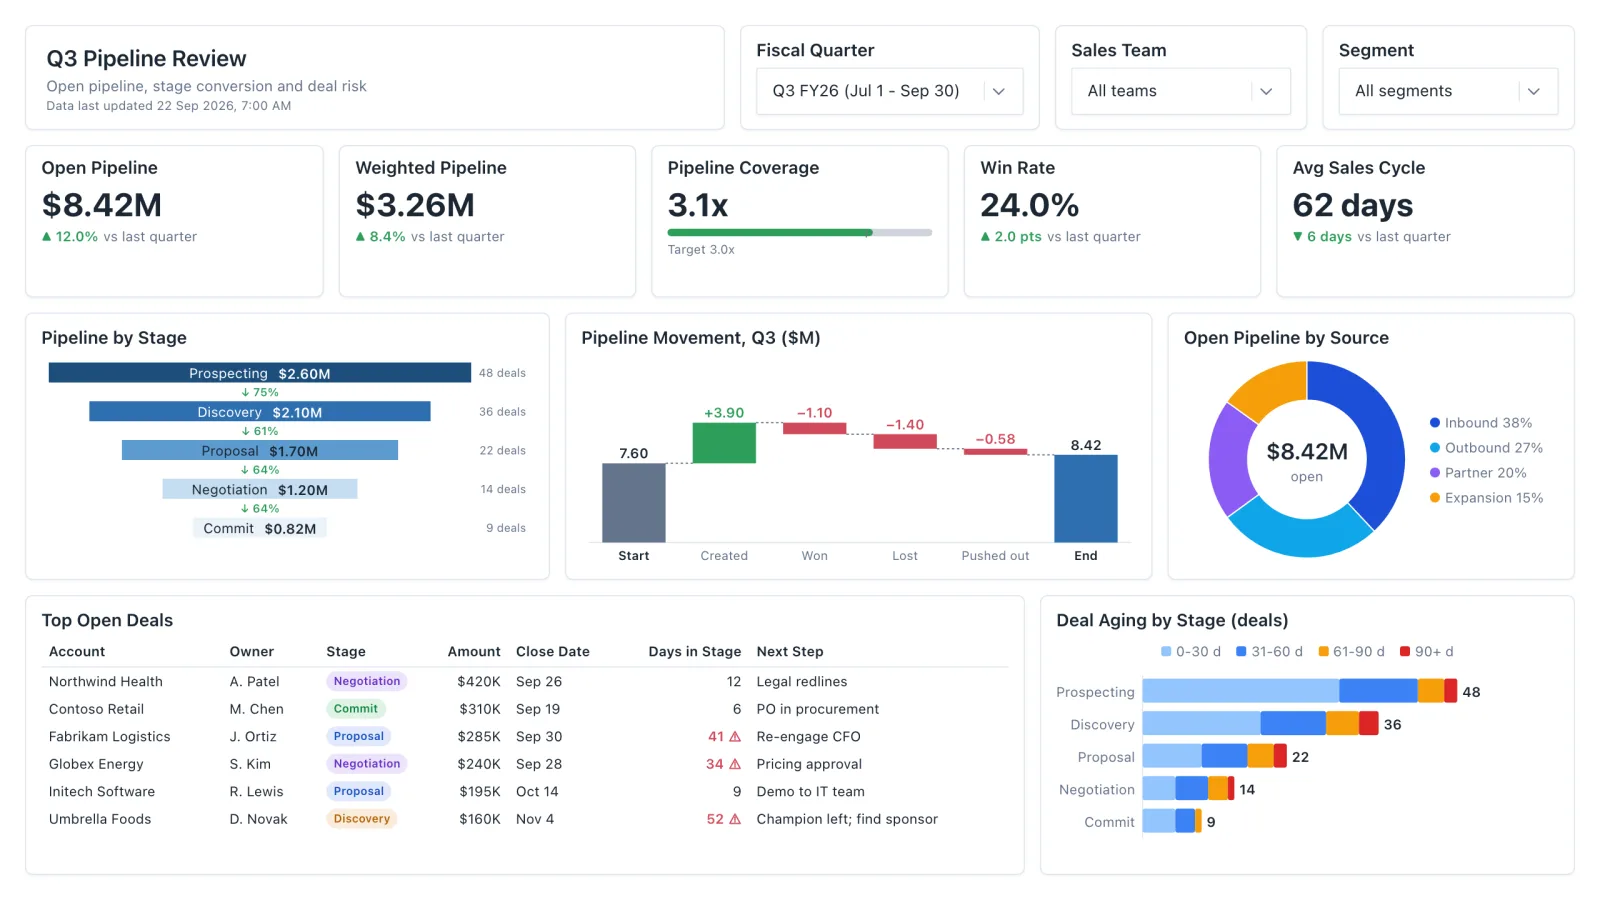
Sales Pipeline
Sales pipeline dashboard with open and weighted pipeline, coverage vs target, a stage funnel and stale-deal flags.
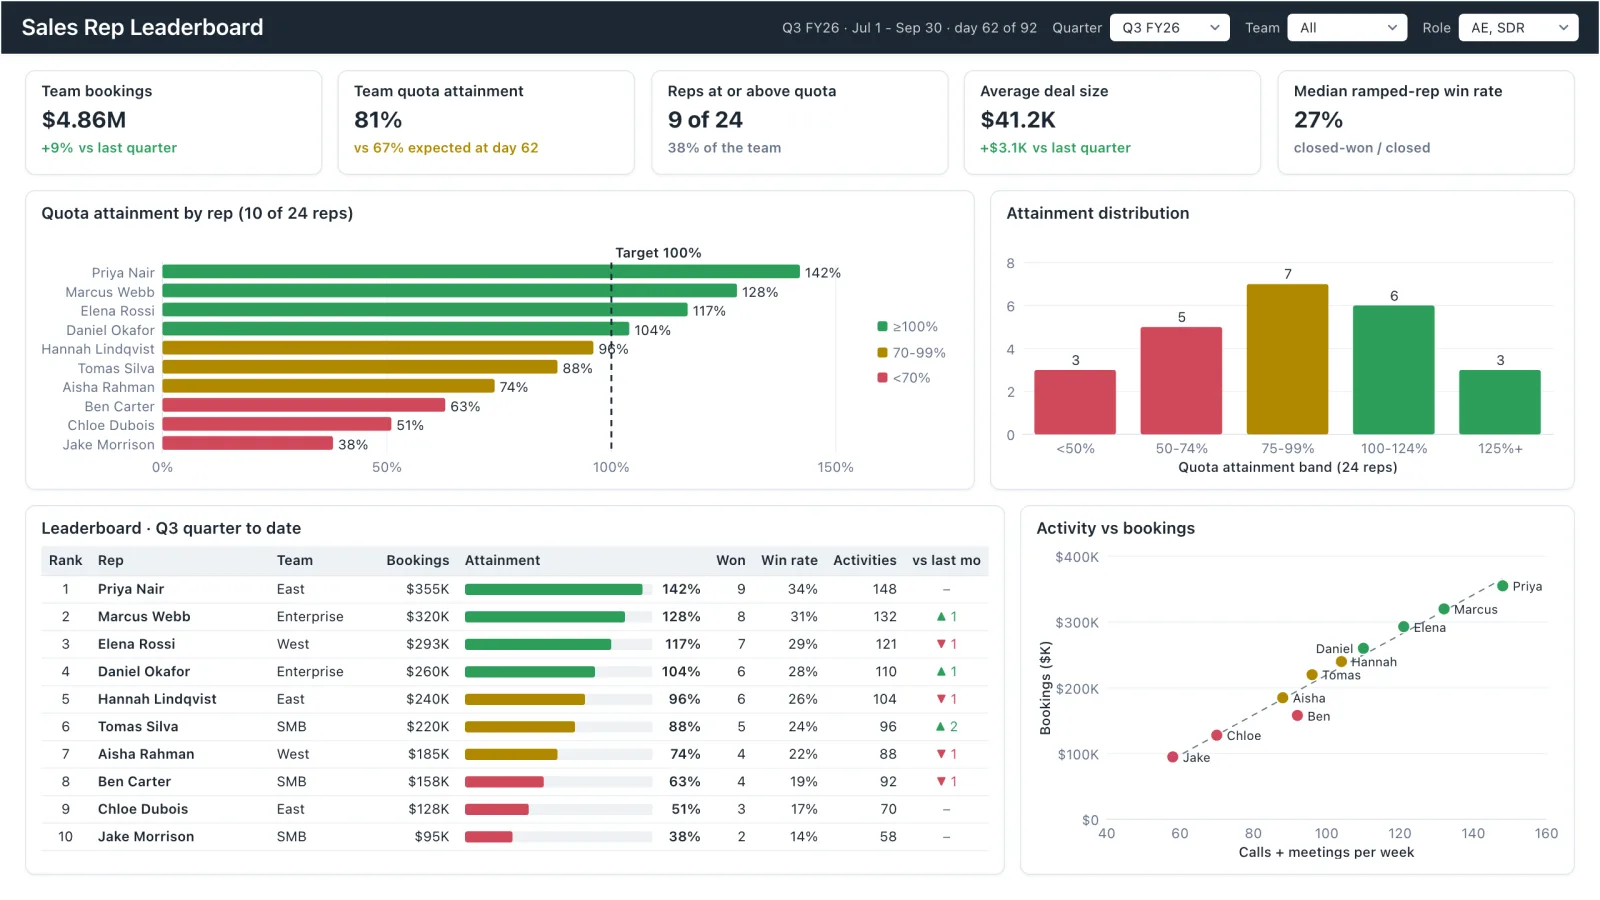
Sales Rep Leaderboard
Sales rep dashboard example with quota attainment by rep, a ranked leaderboard table and activity vs bookings.
Marketing Analytics
Campaign spend, traffic sources, conversion funnel, and lead volume in one wireframe.
Sales, finance, HR, SaaS, and more — filter by team or search by metric.